Talk with our engineers by joining the new Onehouse community Slack!
TL;DR
- Problem: An agent can write SQL against any table very fast. But the schema alone does not tell it whether build success means a successful attempt or the final outcome after retries, so it can only guess.
- Why now: Agents are increasingly doing the majority of querying on the lakehouse. Without understanding of metric definitions, they can provide incorrect or non-repeatable answers.
- What we built: The Onehouse semantic layer, where teams define metrics, dimensions and joins once, certify them, and agents answer business questions using those definitions.
- How it works: Semantic models live in the Onehouse catalog right next to your tables. Agents search and query metrics through the AI Gateway, and the generated SQL runs on Lakegres under the originating user’s identity.
- Why it matters: Across 25 questions curated around our operational needs and tested on real data from our internal data lake, accuracy rose from 68% to 84%, with approximately 3× faster answers and 40% lower cost per answer. Agents use the same certified definitions respecting your existing access policies.
Today we are announcing the Onehouse semantic layer, a way for AI agents to answer business questions consistently from certified metric definitions. Teams can define metrics in the catalog next to their tables, publish versioned models, and query them through the AI Gateway under existing access policies.
Agents can reach every table and still return the wrong number
At the scale Onehouse operates, infrastructure produces a constant stream of image builds, retries and VM lifecycle events. An image build can retry on another runner when its original runner is reclaimed. Those records describe different parts of the same operation. An agent asked for build success rate has to know whether to count attempts or the final outcome of each logical build.
That distinction can completely change the answer. Consider 1,000 logical builds that produce 1,200 attempts, with 980 builds eventually succeeding. Counting successful attempts gives 81.7%; counting the final outcome of each build gives 98%. Both calculations are valid, but they answer different questions. A team tracking build completion needs its agent to use the agreed definition before comparing environments or changing capacity.
We curated 25 questions around our operational needs and tested them on real operations data in our internal data lake. The same model answered 84% correctly with the Onehouse semantic layer, compared with 68% when working directly with raw data. Incomplete or incorrect answers fell by half, from eight to four. Answers were also approximately 3× faster, with a median of 18 seconds versus 52 seconds, and cost about 40% less per answer. The evaluation below covers that measured workload; the build-and-retry walkthrough illustrates how the same product workflow applies to infrastructure automation.
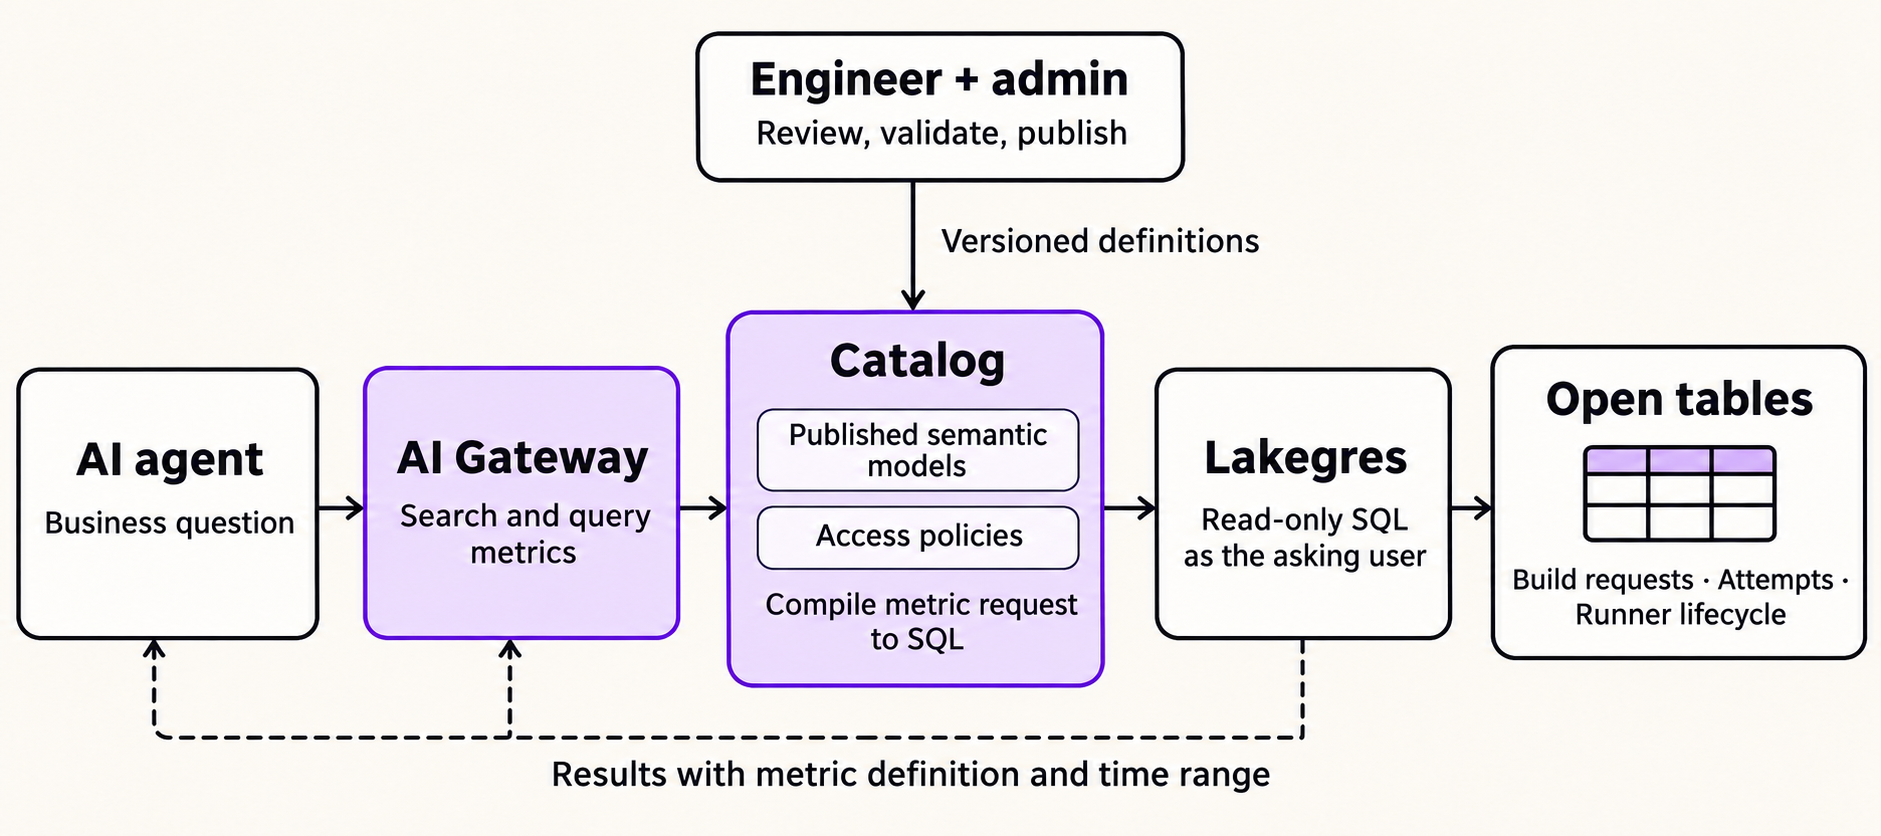
The AI Gateway gives agents tools to find and query metrics defined in the semantic layer. Those definitions determine the calculation, joins and filters, and the generated SQL runs on Lakegres with the permissions of the user asking the question.
Governance on Onehouse today
The semantic layer builds on the governance catalog that already controls access to every table on Onehouse. The catalog is compatible with the Apache Iceberg™ REST catalog protocol, so Apache Spark™, Trino and PyIceberg connect to it as a standard REST catalog. Apache Hudi™, Delta Lake, Parquet, ORC and Hive tables are registered in the same catalog and get the same privileges. Users and groups come from your identity provider through single sign-on and SCIM, and service principals cover programmatic access. Privileges are granted on a lake, a database or a table, and a grant on all tables in a database covers tables created later.
Fine-grained policies sit on top of those grants. A row filter limits which rows a user or group can read from a table. Column policies control which columns they can read, and column masking hashes or redacts values for specific principals. Onehouse Spark, SQL and notebook clusters apply these rules in the query plan before execution. Lakegres enforces the same policies on every query, including the tool calls agents make through the AI Gateway. The control plane passes the end user’s identity to each engine, so a policy applies per user even on a shared cluster, and a new grant or revocation takes effect within seconds.
OneSync extends this to the catalogs your other engines use. It registers the same tables in AWS Glue, Databricks Unity Catalog, Snowflake and Microsoft OneLake, and it syncs database and table privileges to Lake Formation, Unity Catalog, Snowflake Horizon and OneLake security. Engines outside Onehouse read the same copy of the data under grants you manage in one place.
What a semantic layer is and why you need one
A semantic layer is a set of definitions that maps business terms to the tables underneath. Access control decides who can read the data, and the semantic layer records what the data means. It names the metrics a company reports, such as build success rate, build duration or cloud cost per request, and records how each one is calculated. Each metric comes with the dimensions it can be grouped or filtered by, such as service, owning team or month. The layer also declares how tables join, so combining build requests, attempts and ownership history counts each logical build once and attributes it to the right team.
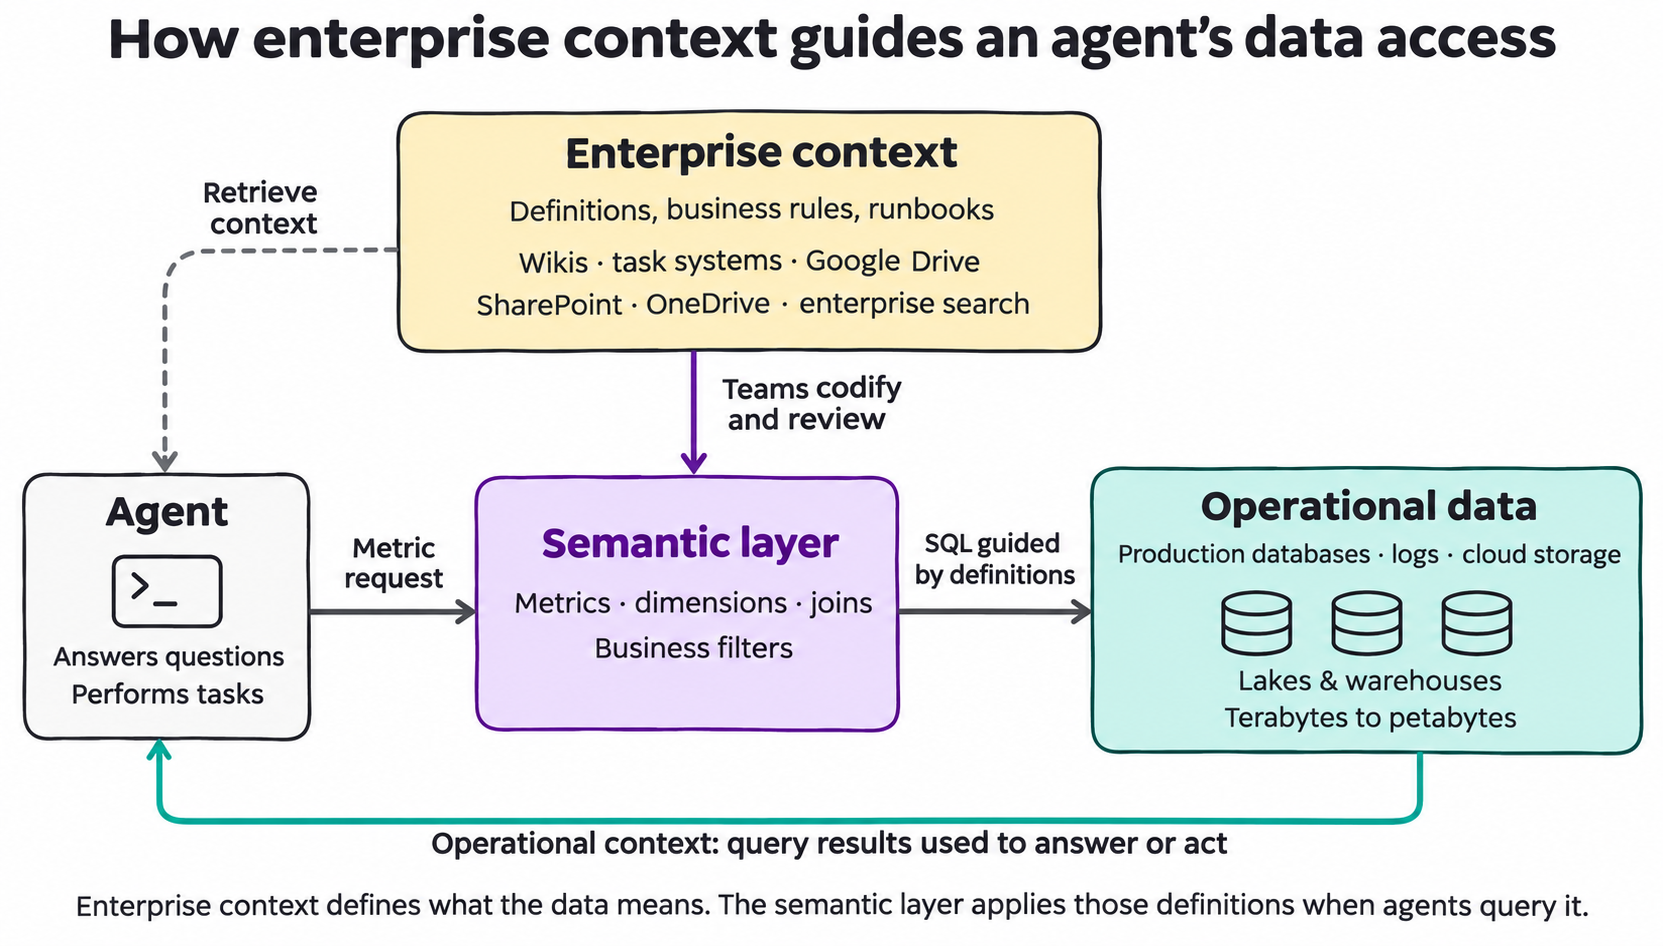
An organization holds both operational data and enterprise context. Operational data comes from production databases, logging systems and cloud storage, and accumulates in lakes and warehouses at terabyte or petabyte scale. Enterprise context explains how the business works: definitions, ownership, runbooks and operating rules spread across wiki pages, task management systems, Google Drive, SharePoint, OneDrive and enterprise search.
Agents need both to answer questions and perform tasks. Querying operational data gives an agent operational context, such as which builds completed or how cloud spending changed. Enterprise context determines how to interpret those records. Teams codify the relevant definitions in the semantic layer as metrics, dimensions, joins and business filters. Those definitions then guide the agent’s data access, while documents and runbooks supply the broader context for deciding what to do with the answer.
Semantic layers come from business intelligence. BI tools needed one place to define a measure so that every dashboard showed the same total, and each tool built its own. The definitions stayed inside that tool, which worked while people read their numbers from dashboards.
Agents query the tables directly and skip the BI tool where the definitions live. An agent reads column names and a few sample rows and infers the rest. It has to guess whether retries count as separate builds, whether unfinished builds belong in the denominator, and which join avoids double counting. Two agents can make different guesses, and each returns a number that looks correct.
With a semantic layer in the path, the agent has less to decide. It picks a metric, the dimensions and a time range from a published list. The SQL comes from the definition, so the filters, the source tables and the joins are the same on every run.
The Onehouse semantic layer
The Onehouse semantic layer puts these definitions in the data platform. Semantic models are stored in the Onehouse catalog alongside the tables they describe. A model defines metrics as simple totals, ratios, derived metrics, cumulative metrics such as year-to-date, and conversion metrics, each with its business filters built in. It also defines dimensions including time, the relationships between tables, and descriptions and synonyms so that everyday wording finds the right metric.
Models are versioned and certified before agents can use them. A team edits a draft, validates it and publishes it as a numbered version. Validation compiles the draft together with every other published model and checks the tables it references. Two teams therefore cannot publish two different metrics under the same name. An older version can be made active again if a change turns out to be wrong.
Through the semantic layer, agents answer from certified metrics only. When a question is ambiguous, for example mean or median build duration, the agent asks which one you mean. When no certified metric fits, the agent says so. A relative range such as “last 7 days” is resolved to exact dates. Each answer carries the metric, its version, the resolved dates and how the number was calculated, and every answer is audited.
Access control applies to every answer. The generated SQL runs on Lakegres, the Postgres-compatible SQL engine Onehouse runs on lakehouse tables. The query is read-only and authenticated as the user who originated the request, so that user’s row filters and column policies apply. A metric’s built-in filters cannot be removed by a caller. Filters added to a request are parsed against a small grammar, and no SQL text written by the caller reaches the engine.
Teams can export semantic models in Apache Ossie (incubating), the open specification that began as Open Semantic Interchange, to carry their definitions between platforms. Published versions are also written as files to object storage in your own account, next to your data.
The components
The semantic layer adds one new object, the semantic model, to three services Onehouse already runs.
| Component | Role |
|---|---|
| Semantic models | Versioned definitions of metrics, dimensions and relationships, written by your teams or drafted by a coding agent. |
| Catalog | Stores the models next to the tables, validates them, holds the access policies and compiles a metric request into SQL. |
| AI Gateway | Gives agents two tools over MCP, one to search published metrics and one to query them. It also routes model calls and records every call in tables in your storage. |
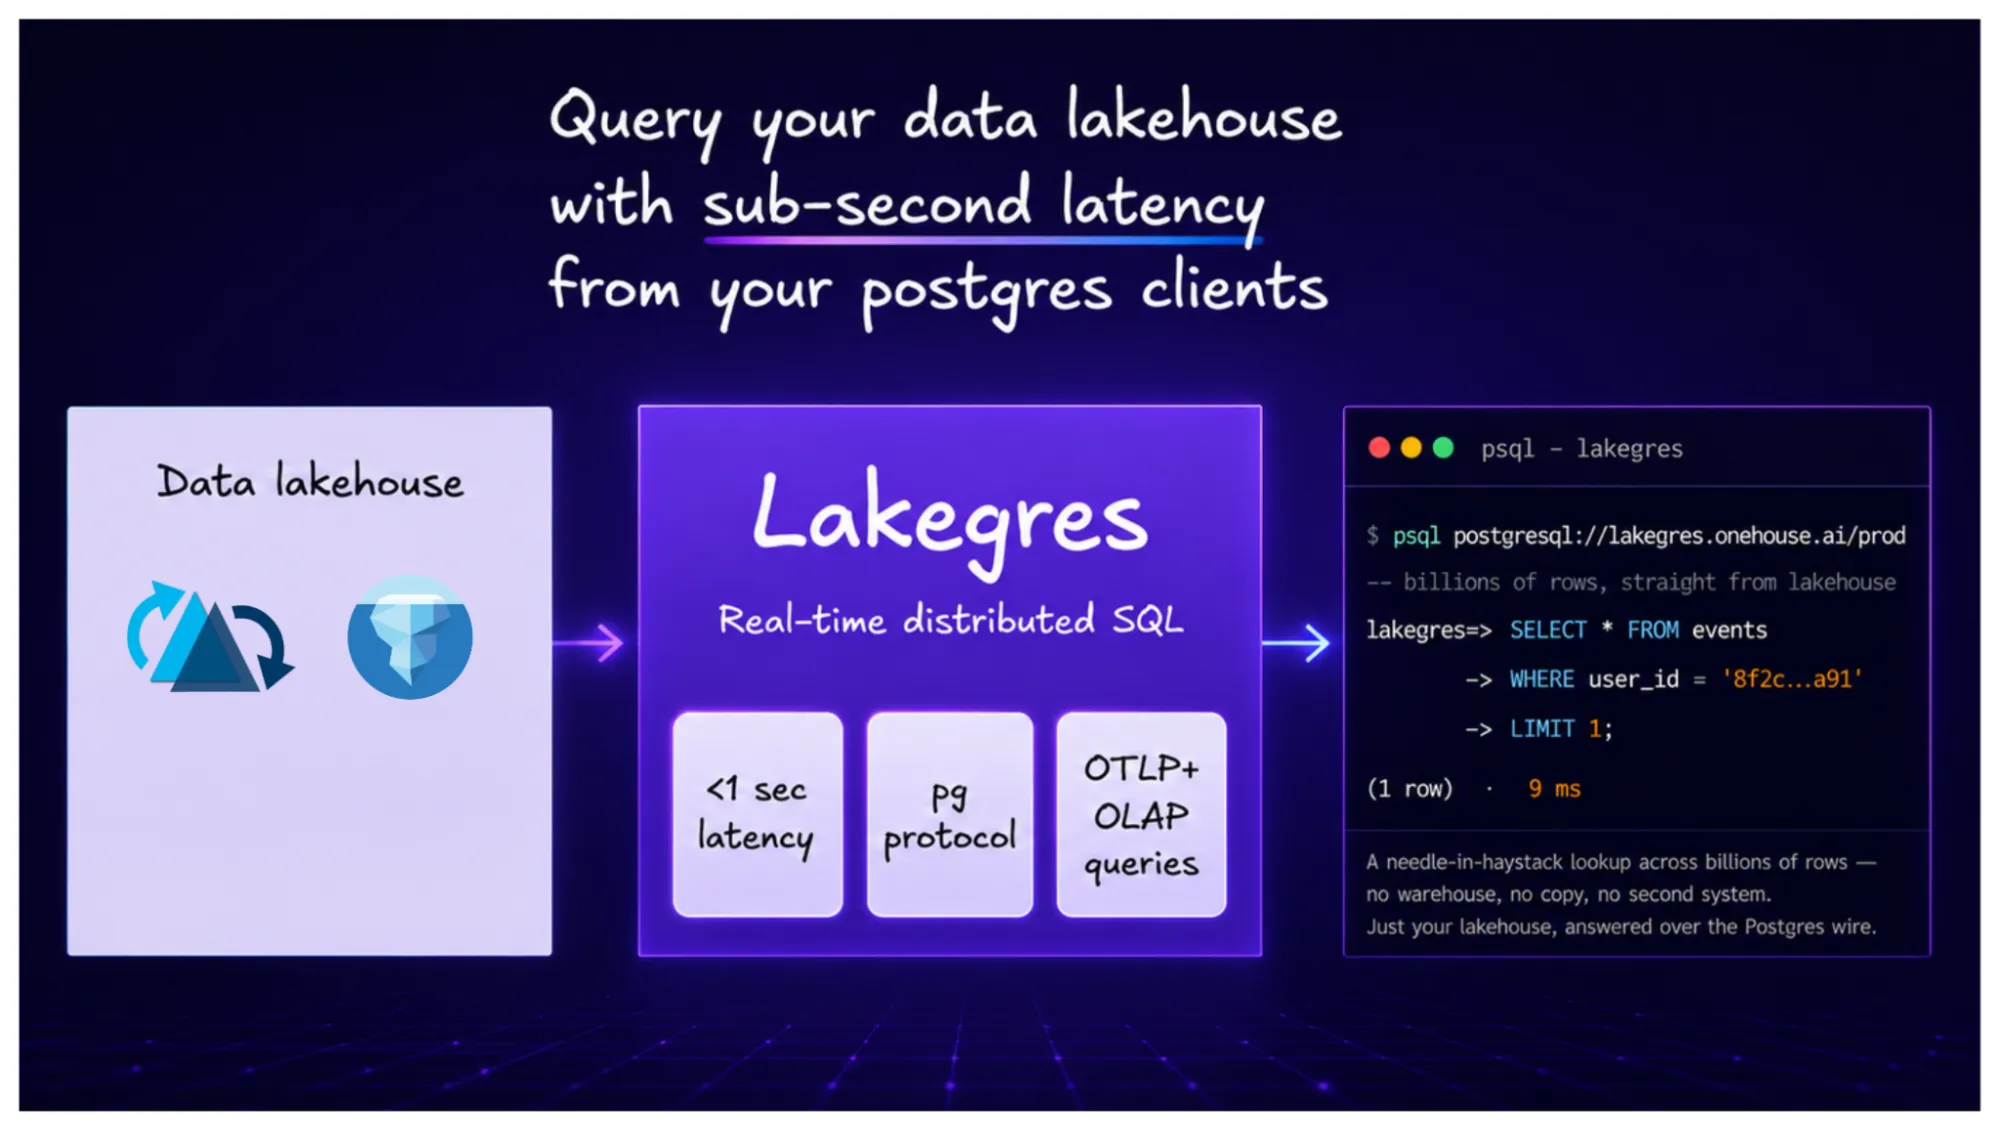
| Lakegres | Runs read-only SQL over the Postgres protocol, authenticated as the user who originated the request. |
How it works: teaching an agent how to count image builds
The walkthrough follows an image-build workload. Build requests, individual attempts and runner lifecycle events live in separate tables. The runbook defines a logical build by its build ID and records how retries contribute to its final outcome.
1. Collect the definitions alongside the data
The operating rule is to count each completed logical build once, after retries have finished. A build with an interrupted attempt can still have a successful final outcome. For this example, the reporting window uses the build’s completion time; builds still in progress are excluded. We keep attempt-level success as a separate metric so engineers can inspect retry overhead without confusing it with the final build outcome.
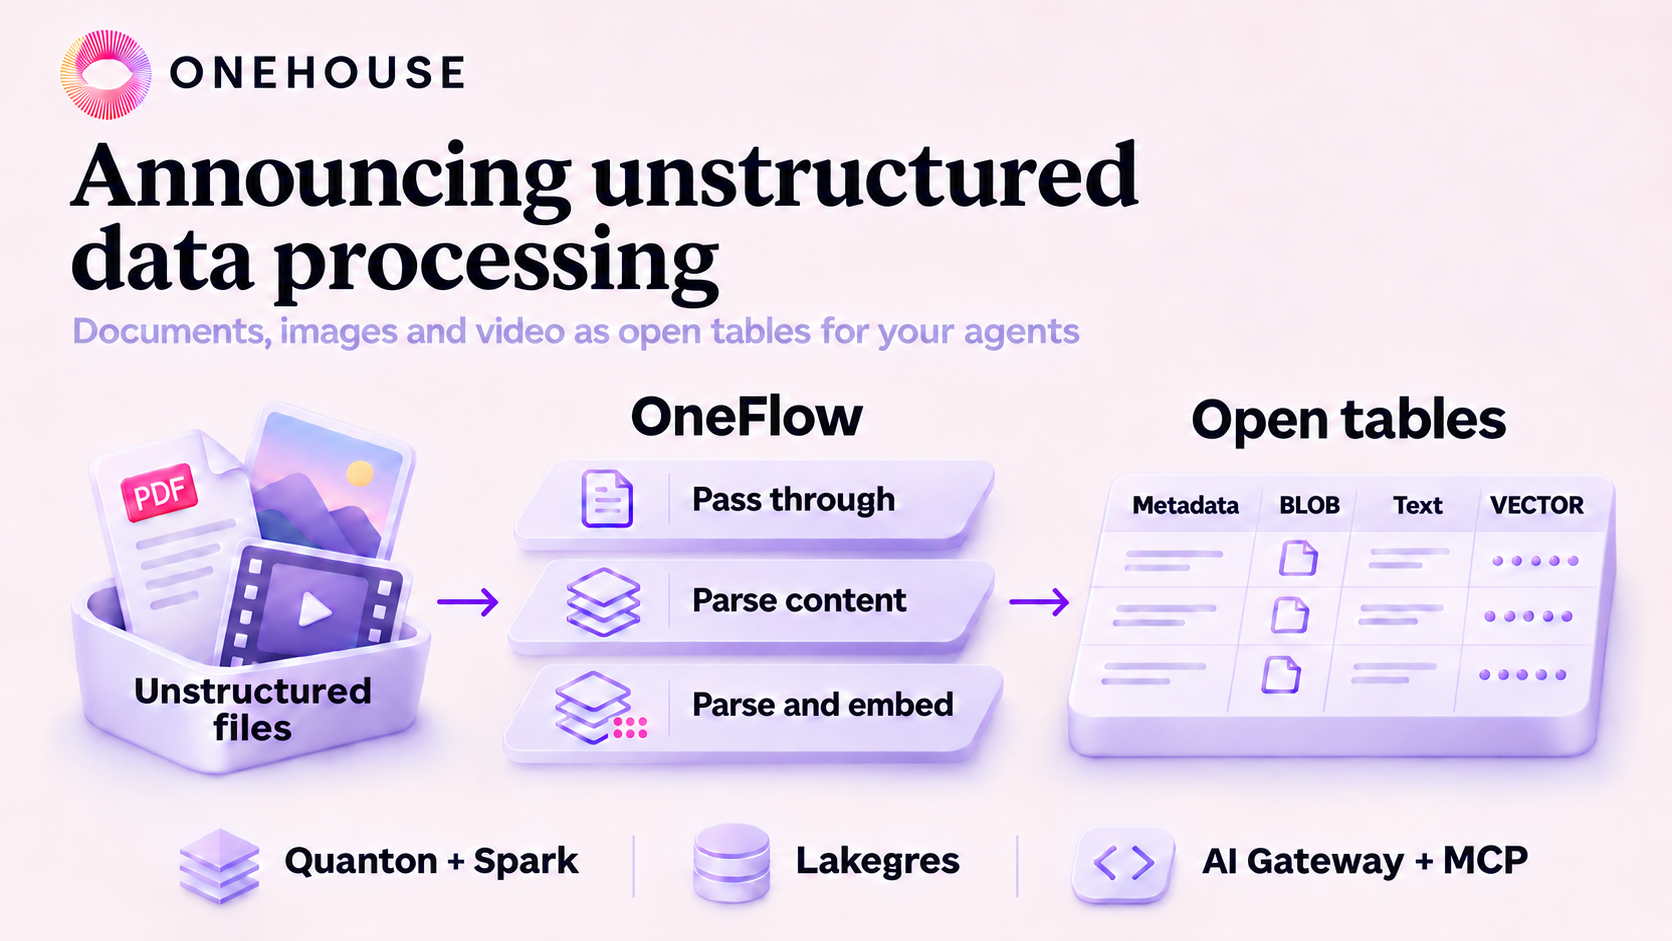
Teams can bring these definitions from runbooks and build-system documentation into the same lakehouse. A OneFlow pipeline can parse those documents and write their text and embeddings into an open table. A coding agent can then retrieve the relevant passages through Lakegres vector search or text search while inspecting the table schemas. That gives it the context to draft a definition for an engineer to review.
2. Turn the operating rule into a reusable metric
A coding agent such as Claude Code or Codex can draft a semantic package from those schemas and definitions. The package names the source tables, declares their relationships, and defines the metrics and dimensions agents can query. An engineer reviews the draft against the operating rules before giving it to an admin to publish.
For this walkthrough, build_success_rate divides successful logical builds by completed logical builds. Both underlying metrics count one final record per build ID, and use the same completion-time window. This definition shows the ratio; its numerator, denominator and source model are defined elsewhere in the package.
metric:
  name: build_success_rate
  label: Build success rate
  description: "Share of completed logical builds whose final outcome is successful, after retries. Count each build ID once, using completion time."
  type: ratio
  type_params:
    numerator:
      name: successful_builds
    denominator:
      name: completed_builds
  config:
    meta:
      onehouse:
        synonyms: ["build completion success", "image build success rate"]
        example_questions:
          - "What was our image-build success rate last week?"
The description helps the agent distinguish this metric from build_attempt_success_rate. Dimensions such as build environment, image family and owning team let users ask for breakdowns while keeping the definition of a completed build consistent.
3. Import, validate and publish the package
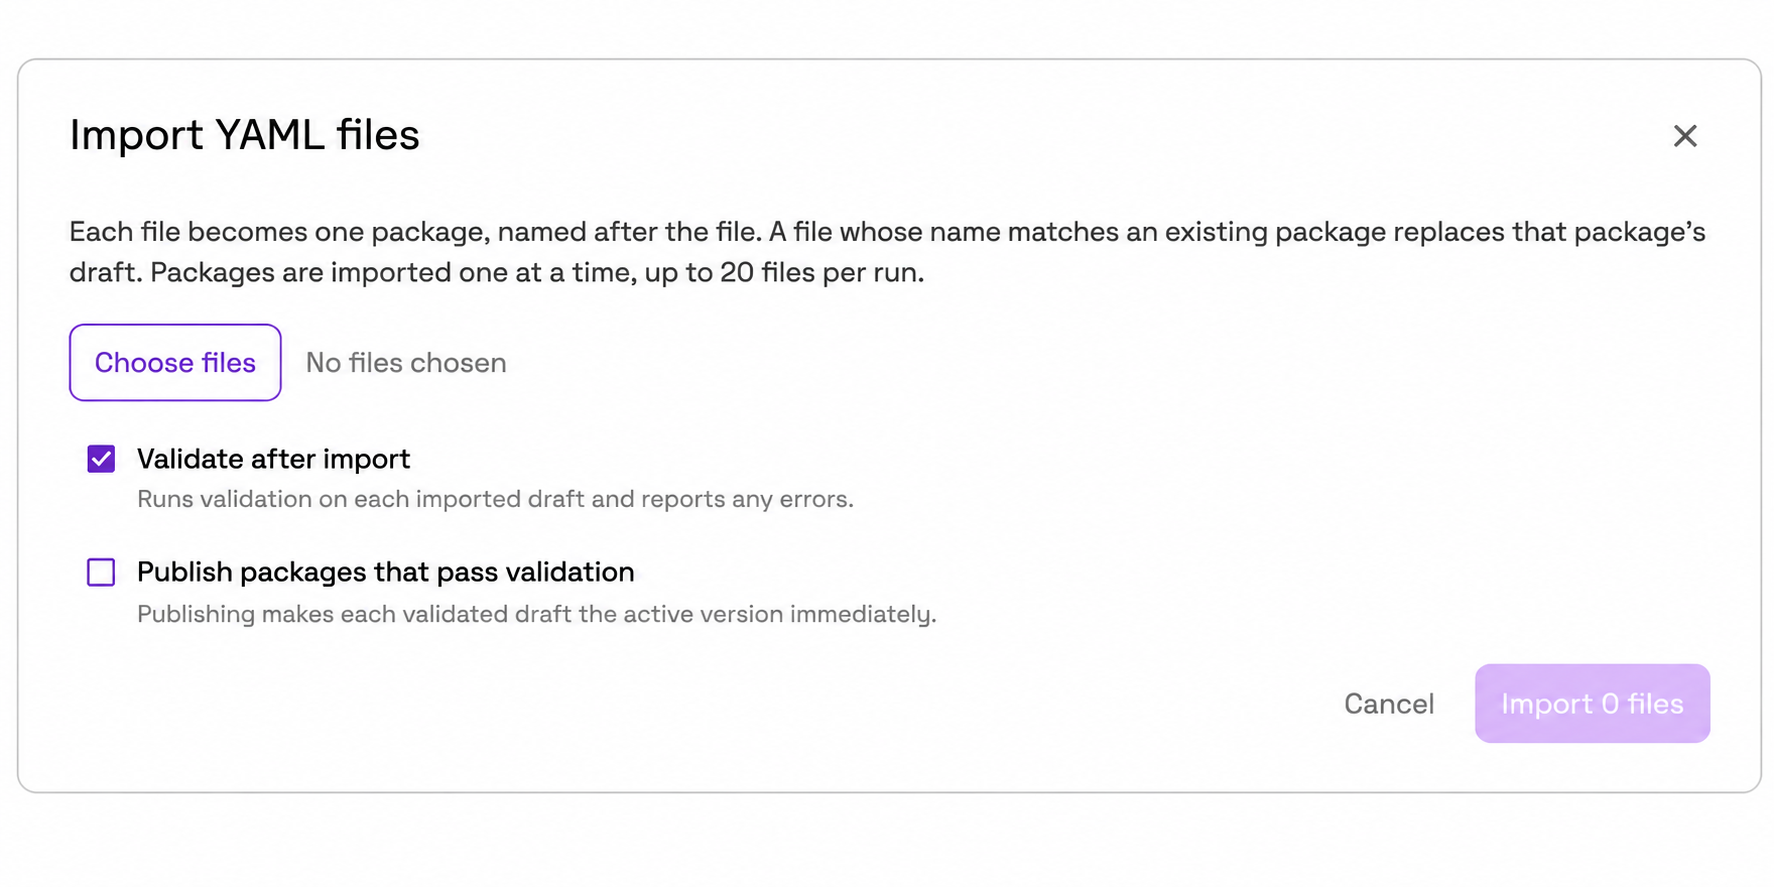
An admin opens Semantic Layer in the Onehouse console and imports the package. Bulk import accepts up to 20 YAML files, with one package per file. It can validate each imported package and publish those that pass, which lets a team bring in a set of related definitions together.
The editor lets the admin inspect and revise the YAML before publishing. Save & validate checks the definitions and confirms that the referenced tables and columns exist. Validation also catches metric names already used by another published model. The attempt-level metric needs its own name so agents can distinguish it from the final build outcome.
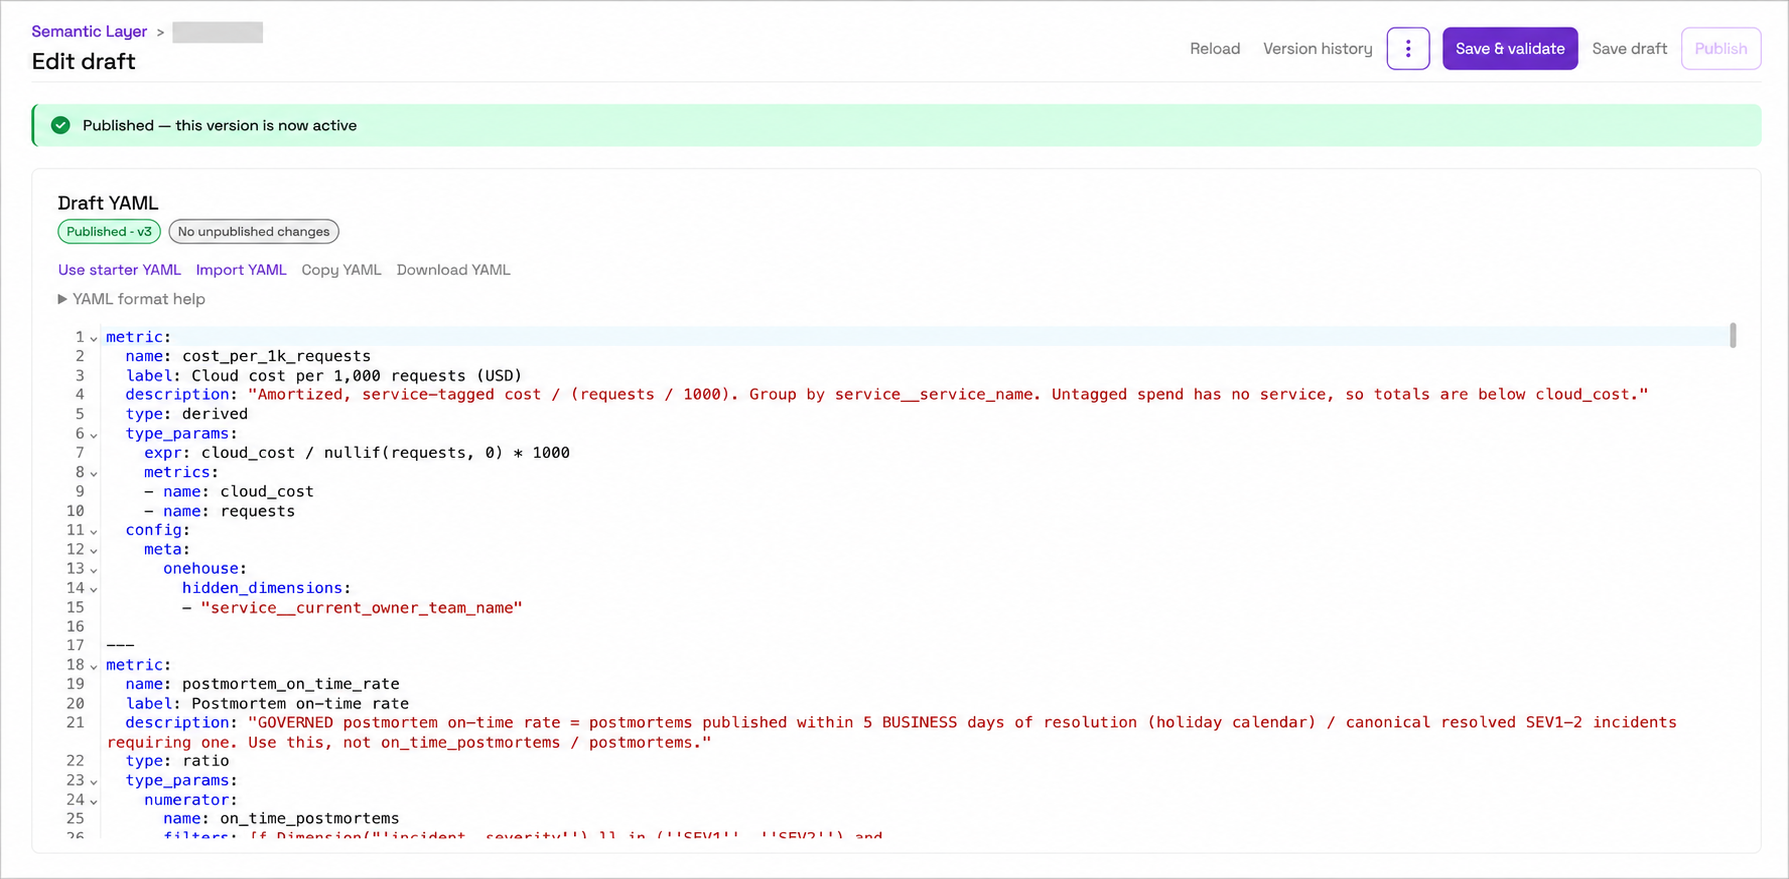
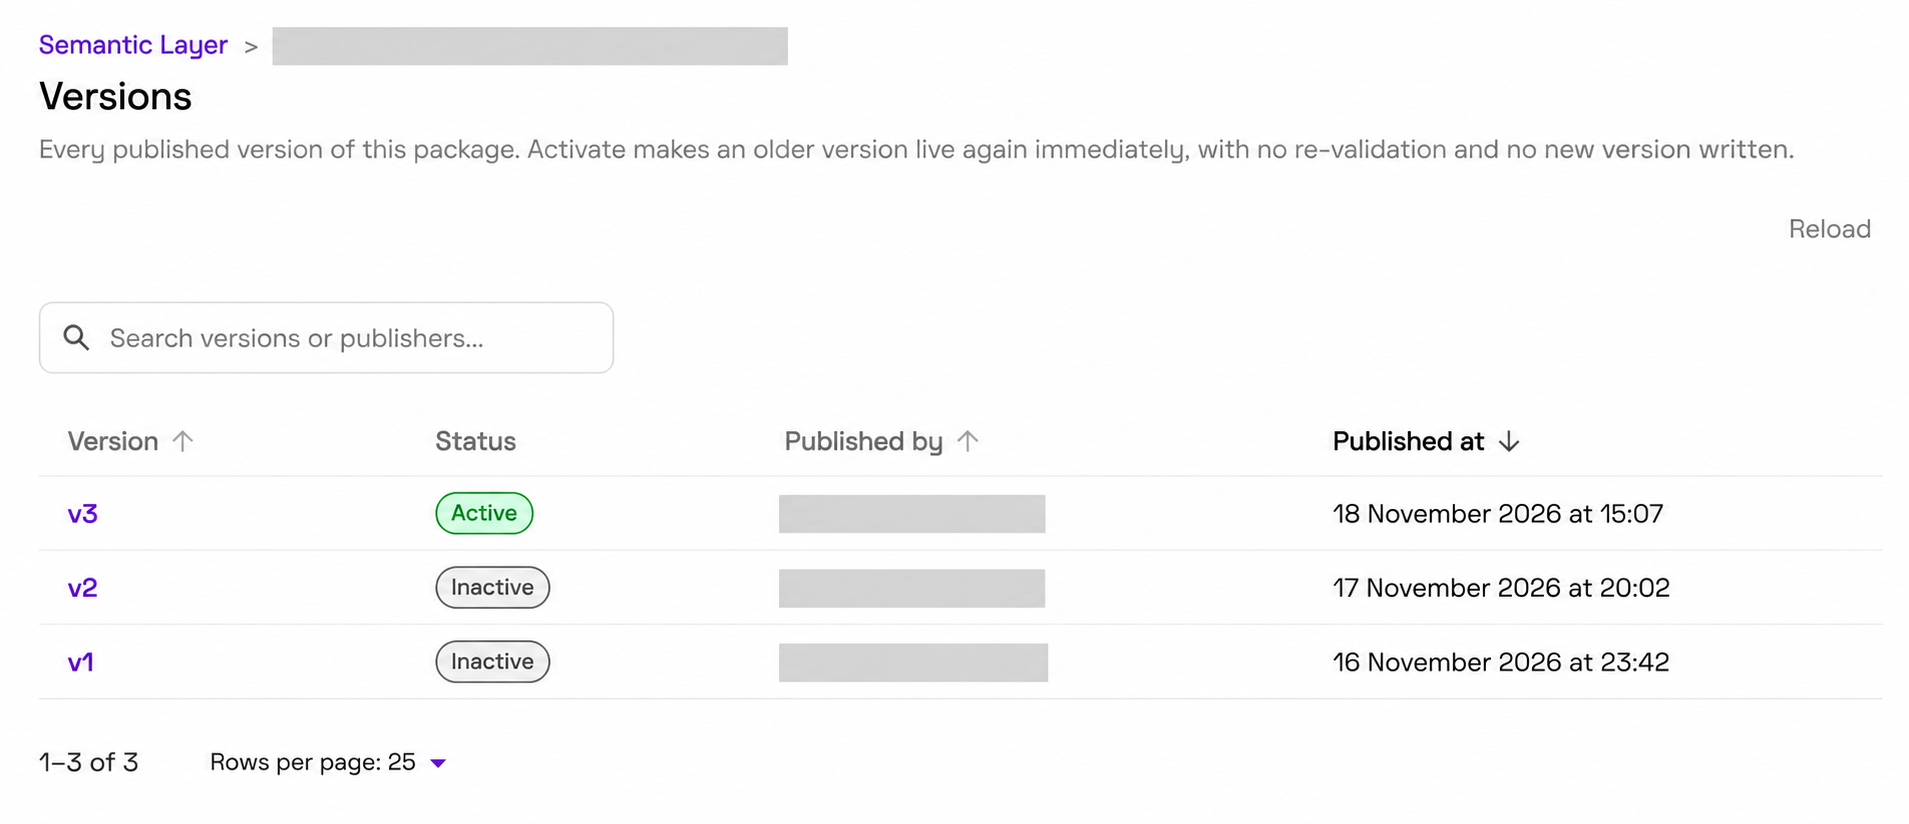
Publish makes the validated draft the active version that agents query. Each later publish creates a new version, with the publisher and time recorded in the version history. An admin can inspect an older published definition or activate it again to roll back a change.
The same import workflow is available from the CLI: oh semantic import PACKAGE_ID --file model.yaml imports one package, and oh semantic import --dir ./packages imports a directory. Teams can keep definitions in their existing code-review workflow and upload the approved files.
4. Ask the question and inspect the answer
The user asks, “What was our image-build success rate last week?” The worked example contains 1,000 completed logical builds and 1,200 attempts. There are 980 successful attempts, each producing one successfully completed build. The remaining 220 attempts include retries and the final attempts of 20 builds that did not complete successfully.
An agent choosing the attempt table could report 980 ÷ 1,200, or 81.7%. That is a useful measure of attempt-level efficiency, but it does not answer the question under the team’s definition of build success.
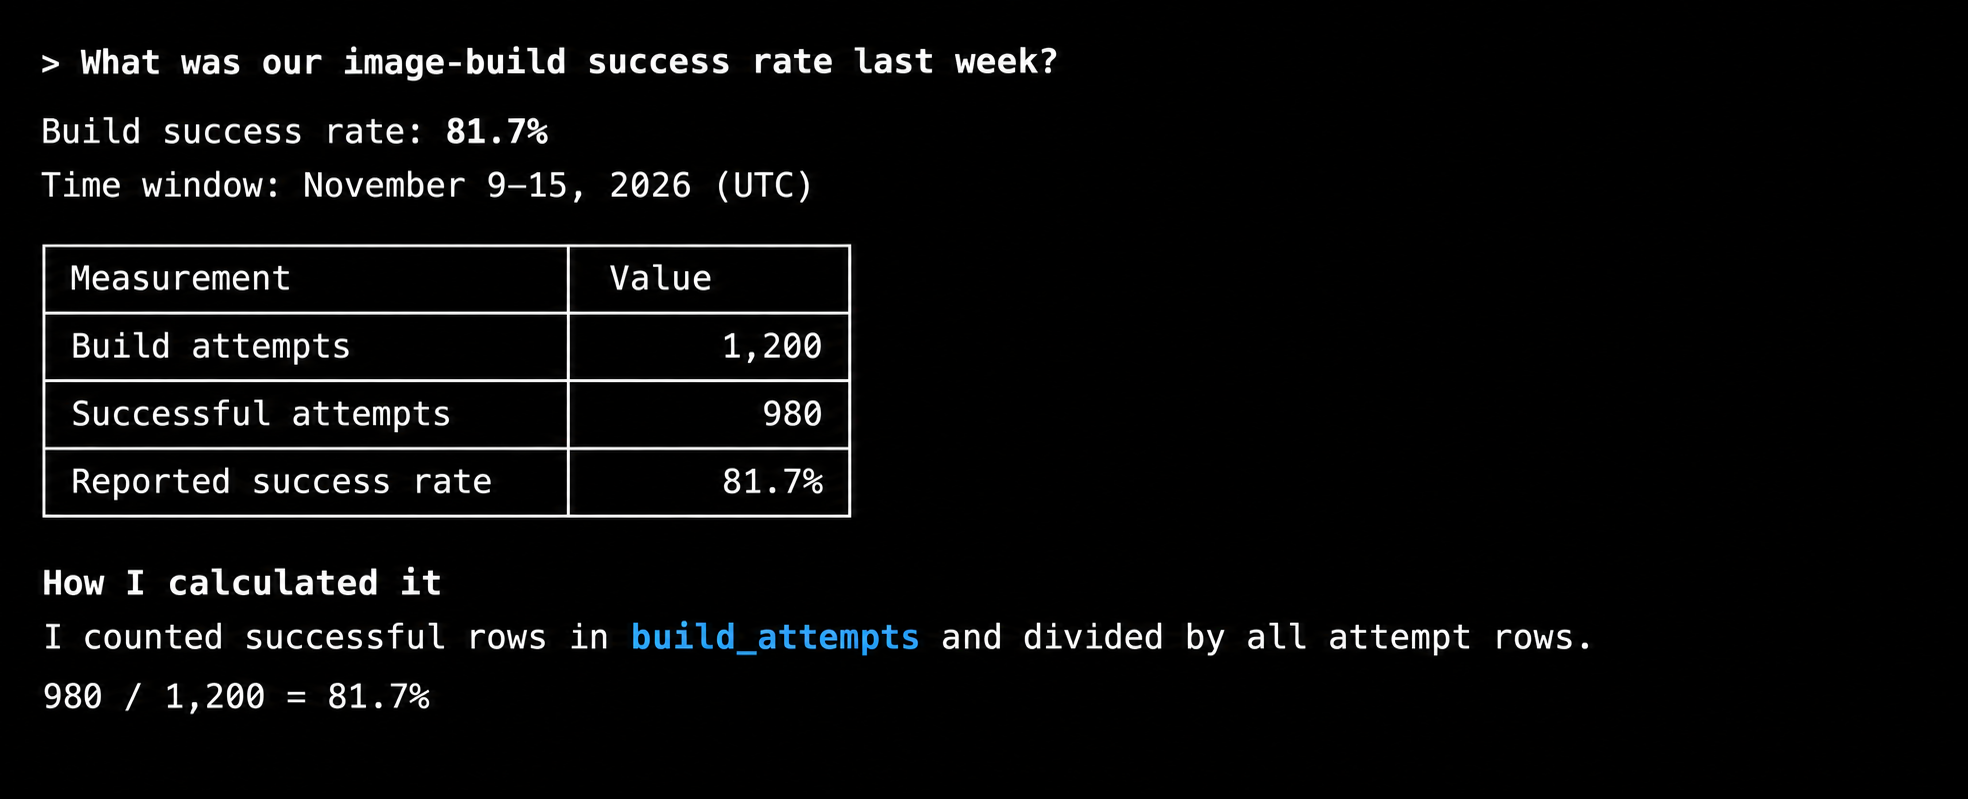
With the published build_success_rate metric, the agent uses the final outcome of each logical build: 980 ÷ 1,000, or 98%. Its answer explains the counting unit, retry handling and time window. The team can then ask for attempt-level success separately to understand how much retry work the runners performed.
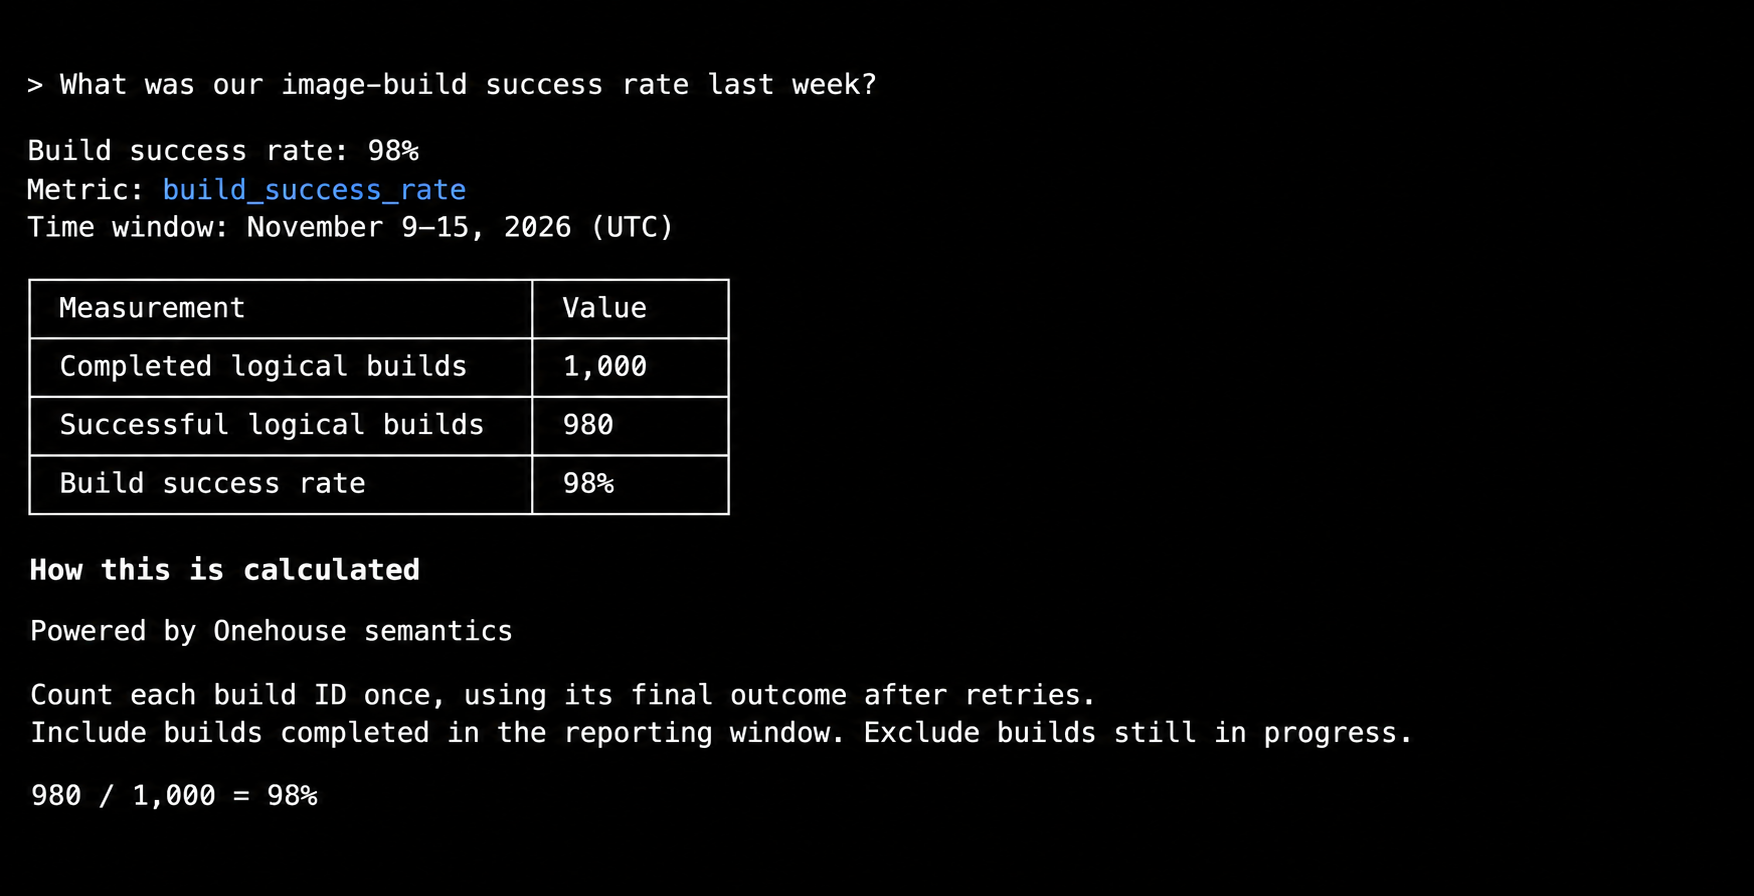
The generated SQL runs under the originating user’s identity. A row policy that restricts an engineering manager to their team’s builds still applies; a user with broader access can query across teams using the same metric definition. The semantic layer supplies the calculation while the catalog enforces access to the underlying data.
5. Use agent traces to improve metric coverage
The AI Gateway records model and tool calls in tables in your own storage. A platform team can query those traces on Lakegres to see which metrics agents use and where the published definitions fall short. If engineers keep asking about time spent retrying builds and the catalog only defines final build duration, that gives the team a concrete metric to add. Reviewing those questions helps the semantic layer grow with the infrastructure it describes.
Accuracy rose from 68% to 84% on 25 business questions
We curated 25 evaluation questions around our operational needs, including questions whose answers depend on company definitions. We tested them on real operations data from our internal data lake: 30 tables and 1.37 million records, stored in 42.5 MB of Parquet, covering deployment activity, service operations, ownership and cloud costs. It included duplicate and decoy tables, quarantined data, and ownership changes over time. The questions ranged from operational counts to rolling metrics and cost anomalies, with an answer key computed independently in SQL.
The same Claude Opus 5.5 model answered every question in two configurations. In the raw-data configuration, Claude Code used a shell, Python and DuckDB to inspect a read-only local copy of the S3 files. In the semantic configuration, it used the AI Gateway’s metric search and query tools, backed by 21 semantic models and 84 metrics over curated tables from the same dataset. Each question started a fresh session with the same question wording and reference date. The semantic configuration reused definitions and curated tables prepared ahead of time; the raw-data agent had to infer those rules while answering each question. The comparison measures the benefit of that reusable context across the two workflows.
| Result across 25 questions | Agent using raw data | Agent using the Onehouse semantic layer |
|---|---|---|
| Fully correct answers | 17 of 25 (68%) | 21 of 25 (84%) |
| Partially correct answers | 6 | 4 |
| Wrong answers | 2 | 0 |
| Median answer time | 52 seconds | 18 seconds |
| Reported cost per answer | About $0.27 | About $0.16 |
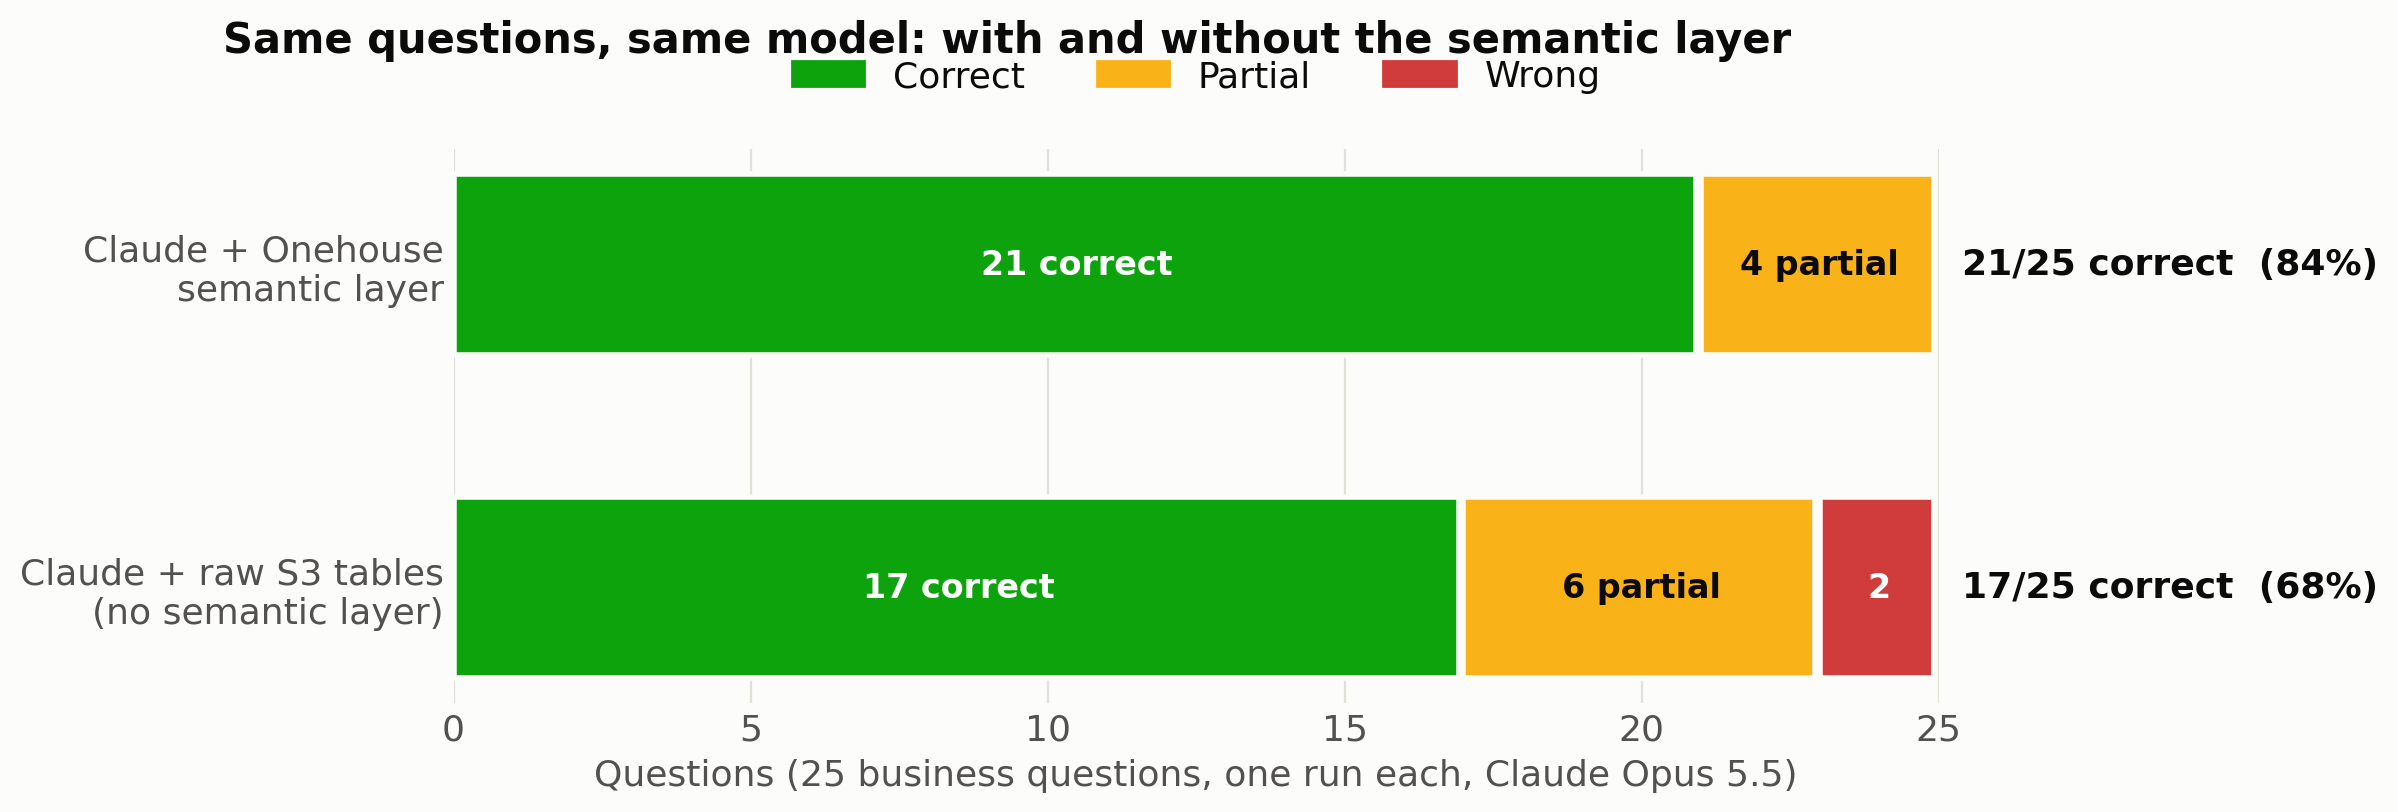
Accuracy improved by 16 percentage points, and the number of incomplete or incorrect answers fell from eight to four. The semantic layer answered five questions correctly that the raw-data agent missed or answered partially. Those gains came from definitions: which records count toward a metric, which target or ownership rule applied at the time, and how shared cloud costs are allocated. Time and cost figures compare the two agent workflows described above.
Definitions also reduced the work needed to answer
The timing and cost results include the benefit of definitions prepared ahead of time. With the semantic layer, the agent could search for a metric and query its published definition. Working from raw data required it to discover tables, inspect records, work out joins and decide which business rules to apply while answering each question.
What improved, and where answers were still incomplete
| Outcome | Questions | What distinguished them |
|---|---|---|
| Both fully correct | 16 | Included straightforward operational counts and cloud spend by environment. |
| Only the semantic agent fully correct | 5 | Required business definitions, historical context or shared-cost allocation. |
| Only the raw-data agent fully correct | 1 | The semantic agent returned the correct counts but omitted the denominator needed for a rate. |
| Neither fully correct | 3 | Both returned partial answers on advanced statistics or a rolling metric at hourly grain. |
Shared cloud-cost allocation illustrates one of the measured improvements. The raw-data agent identified the team with the largest increase in spend, but left a shared cloud account unallocated, so several team totals differed from the answer key. The semantic agent used the published cloud_cost definition and matched the expected spend and month-over-month changes for all ten teams.
The semantic layer’s four partial answers involved a missing rate, missing breakdowns or statistics the agent computed beyond the available metrics. These results give us specific work to do on metric coverage and how the agent chooses and combines metrics.
How we graded the answers
The semantic models included descriptions and example questions written with this curated question set in mind. The comparison used one run per question per configuration, with a separate model grading against the answer key and manual checks of every non-correct verdict. Partial answers did not count as correct. An earlier two-run check of the semantic configuration produced the same verdict for all 25 questions; the full raw-data run was not repeated. The build walkthrough is a worked example; the results here come from the 25-question evaluation.
Runs where your data runs
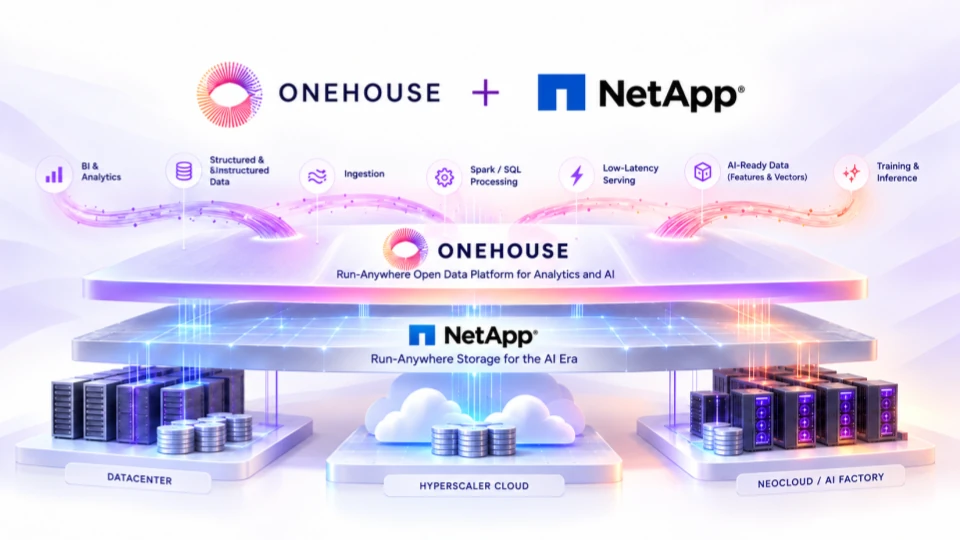
The components that serve a question run in your own environment. The catalog, the AI Gateway and Lakegres are Kubernetes services in the Onehouse data plane. The data plane runs in your cloud account on AWS or Google Cloud, on your own Kubernetes on Azure or in a datacenter, and on neoclouds. Model calls go to the providers you configure with your own credentials, and Onehouse adds no charge on the tokens routed through the gateway. Published semantic models and agent traces are written to object storage you own. Semantic layer functionality is available in all deployment models and clouds Onehouse currently operates in.
What’s next
Next, we want to make it easier to build and maintain semantic models from the knowledge companies already have. We are working toward tighter integration between Onehouse’s unstructured data processing and coding agents such as Claude Code, so teams can turn runbooks, metric documentation and other business context into reviewed definitions across a large catalog.
Those definitions also need to keep up with the business. As documents, schemas and operating rules change, we want to help teams detect stale context and propose updates to the affected models. Engineers should be able to review what changed and why, then publish a new version through the same validation workflow.
We have concerns about how open metric definitions and access policies are across the industry today, and we are working on several of those problems. A separate post will cover them, along with how we think governance should work across catalogs and engines.
If you want to try the semantic layer on your own tables, you can reach us through the contact page or the community Slack. The platform guide has the reference.