Talk with our engineers by joining the new Onehouse community Slack!
TL;DR
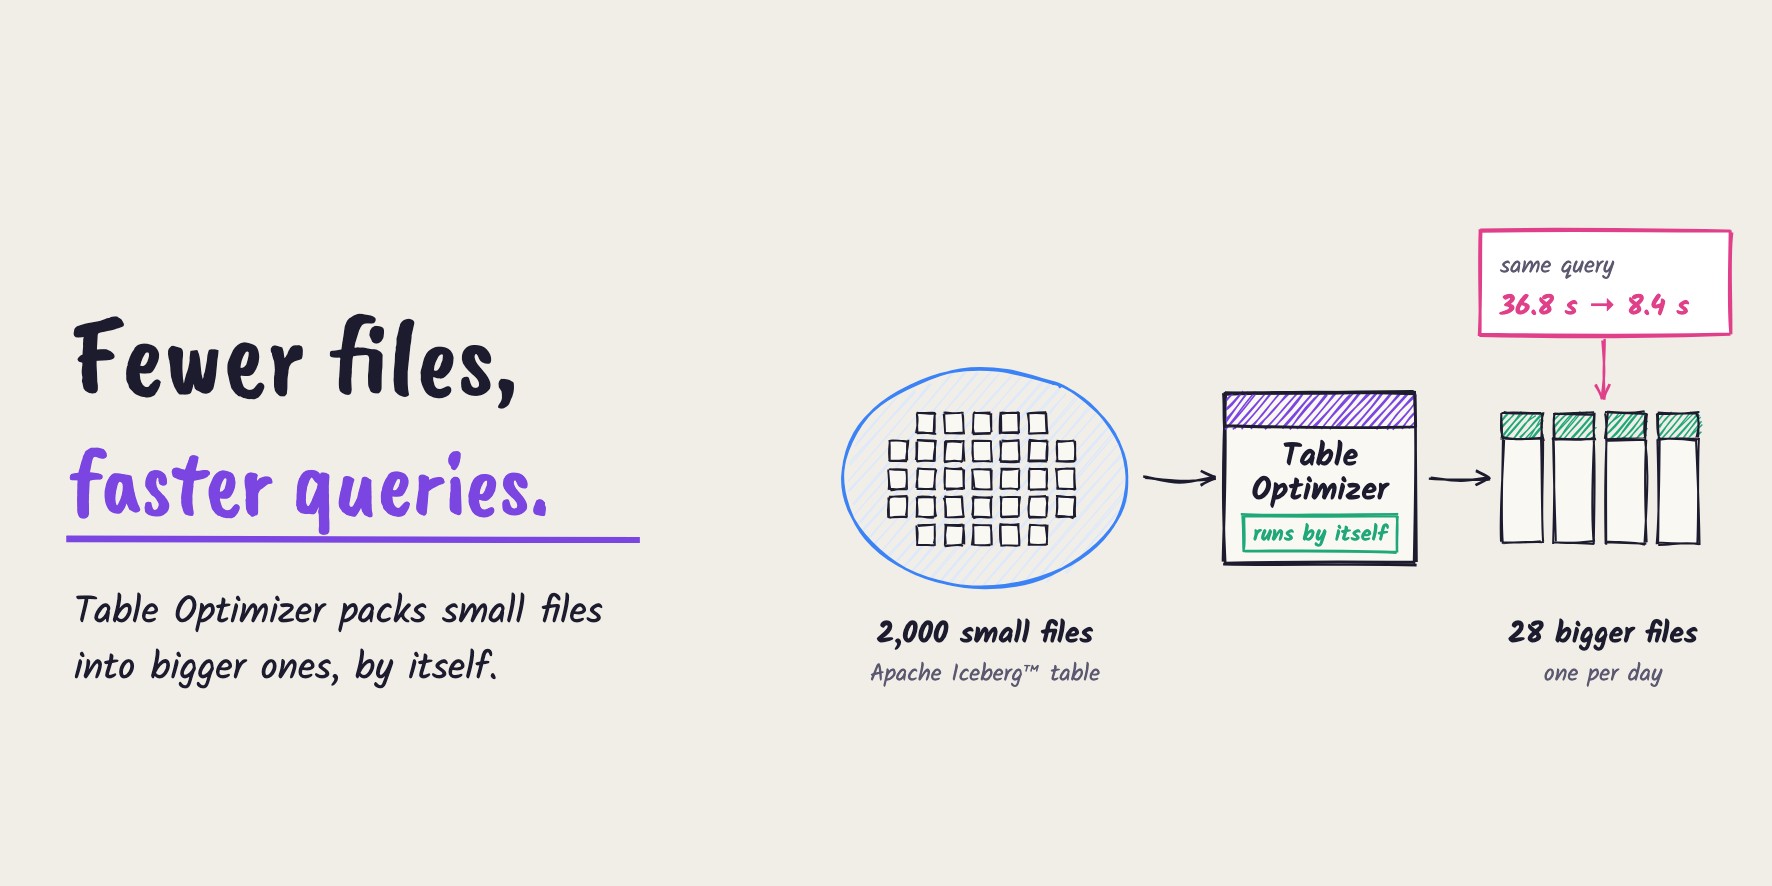
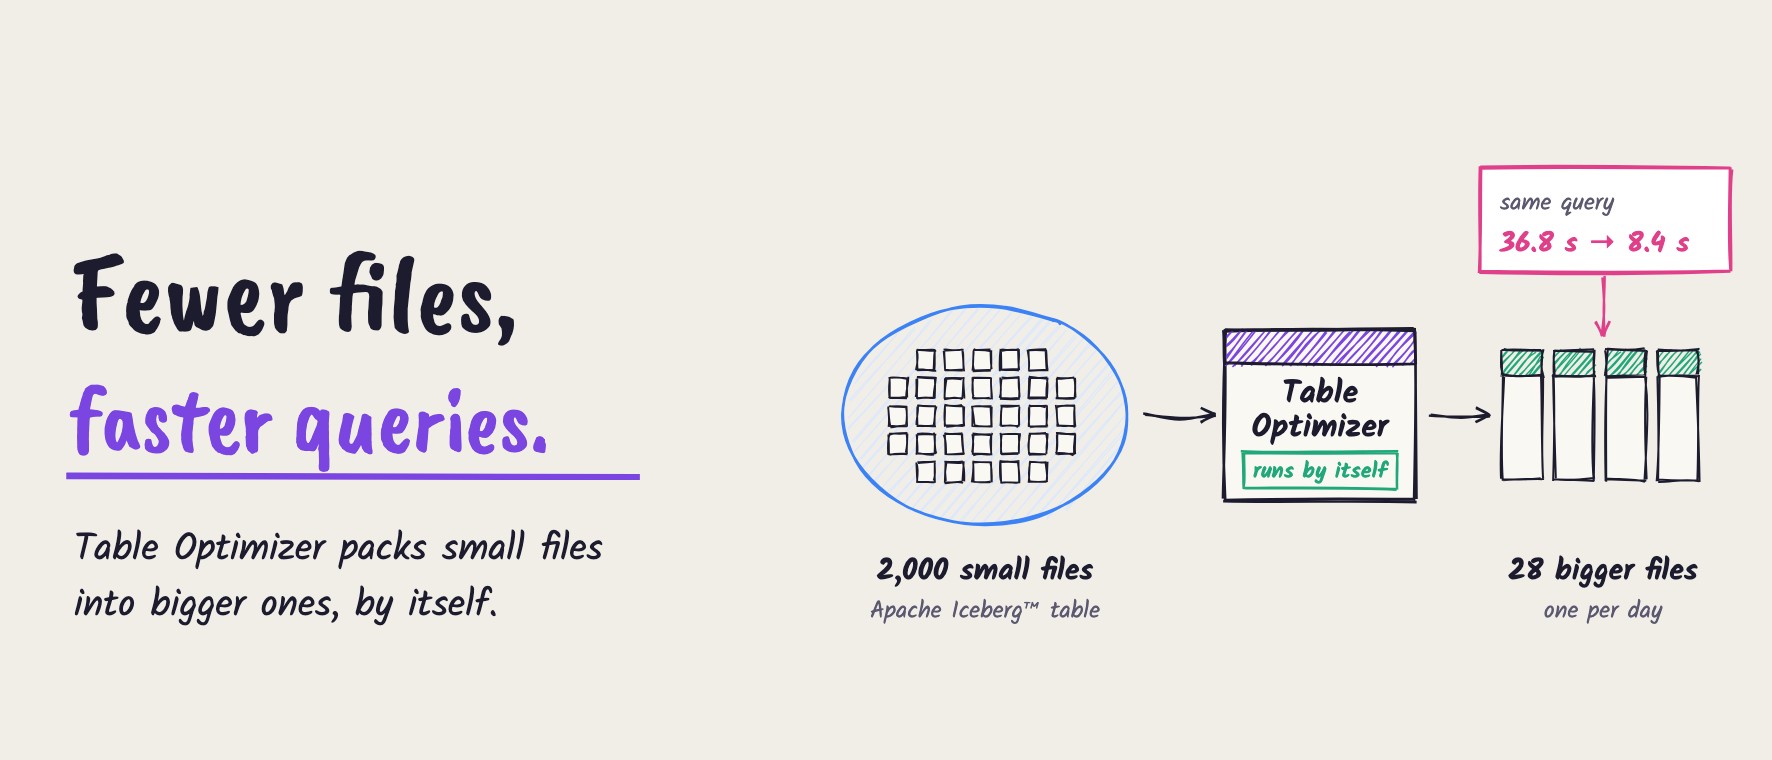
Small files make Apache Iceberg™ queries slow, because every query has to open many files. Onehouse Table Optimizer fixes this in the background. Our Iceberg table, in the AWS Glue Data Catalog, had 2,000 small files of 78–190 KiB. In the Onehouse console, we created a Table Optimizer cluster, an observed lake and one clustering service. Table Optimizer then ran by itself and packed the files into 28 files, one per day, of 3.3–14.8 MiB. No rows were lost. The same DuckDB query went from 36.8 seconds to 8.4 seconds, about 4.4× faster. We changed nothing in how the data is written or queried.
Fix slow Apache Iceberg™ queries caused by small files
Think of a table as a shelf of boxes. When data lands in small, frequent batches, each batch adds a few small boxes. After a few weeks, the shelf holds thousands of them, and every query has to open box after box to find its rows. The query gets slow, even though the data is small.
The usual fix is a rewrite job that merges the small files into bigger ones. You have to size that job and run it on a schedule, while new data keeps landing. Onehouse Table Optimizer does this work for you, in the background. In this post, we set it up on an Apache Iceberg™ table step by step, and we measure the same query before and after.
Why do small files make Iceberg queries slow?
Our example table, click_events, holds four weeks of click events from an online sneaker shop. The data landed in 100 small batches, and each batch added about 20 small files on average. At the end, the table had:
- 2,000 data files, each only 78–190 KiB
- 13,864,689 rows
- one partition per day, on the
event_timecolumn
Our test query reads one customer’s events across all four weeks. The rows of one customer are spread across many small files, so the engine has to open them all to find them. On a laptop, with DuckDB reading the table from Amazon S3, the query took 36.8 seconds.
How does Onehouse Table Optimizer fix it?
Table Optimizer keeps the table in good shape while data lands. You need three things in the Onehouse console:
- A Table Optimizer cluster. This cluster type only runs table upkeep (table services) for observed Iceberg tables. It doesn’t run Flows, jobs or queries (cluster docs).
- An observed lake. Onehouse works on the table in place, through its catalog. It doesn’t move the table or copy it anywhere else. To optimize it, Onehouse writes the new, bigger files next to the old ones and commits them to the same table (observed Iceberg tables).
- A clustering service on the table. On Iceberg, clustering uses Iceberg’s own
rewrite_data_filesprocedure. It sorts the rows by the keys you pick and writes fewer, bigger files. Each run adds a “Replace” snapshot to the table (clustering on Iceberg).
Before you start
Our table is registered in the AWS Glue Data Catalog. Its Glue Iceberg REST catalog is already connected to Onehouse, with the name glue_iceberg. The table and its database, sneakershop_web, stay in Glue the whole time.
Onehouse needs write access, not only read access. It writes the new files to the table’s S3 location and commits new snapshots to the table in Glue. So the catalog connection must allow S3 writes and Glue commits.
How to set up Table Optimizer, step by step
Step 1: Add a Table Optimizer cluster
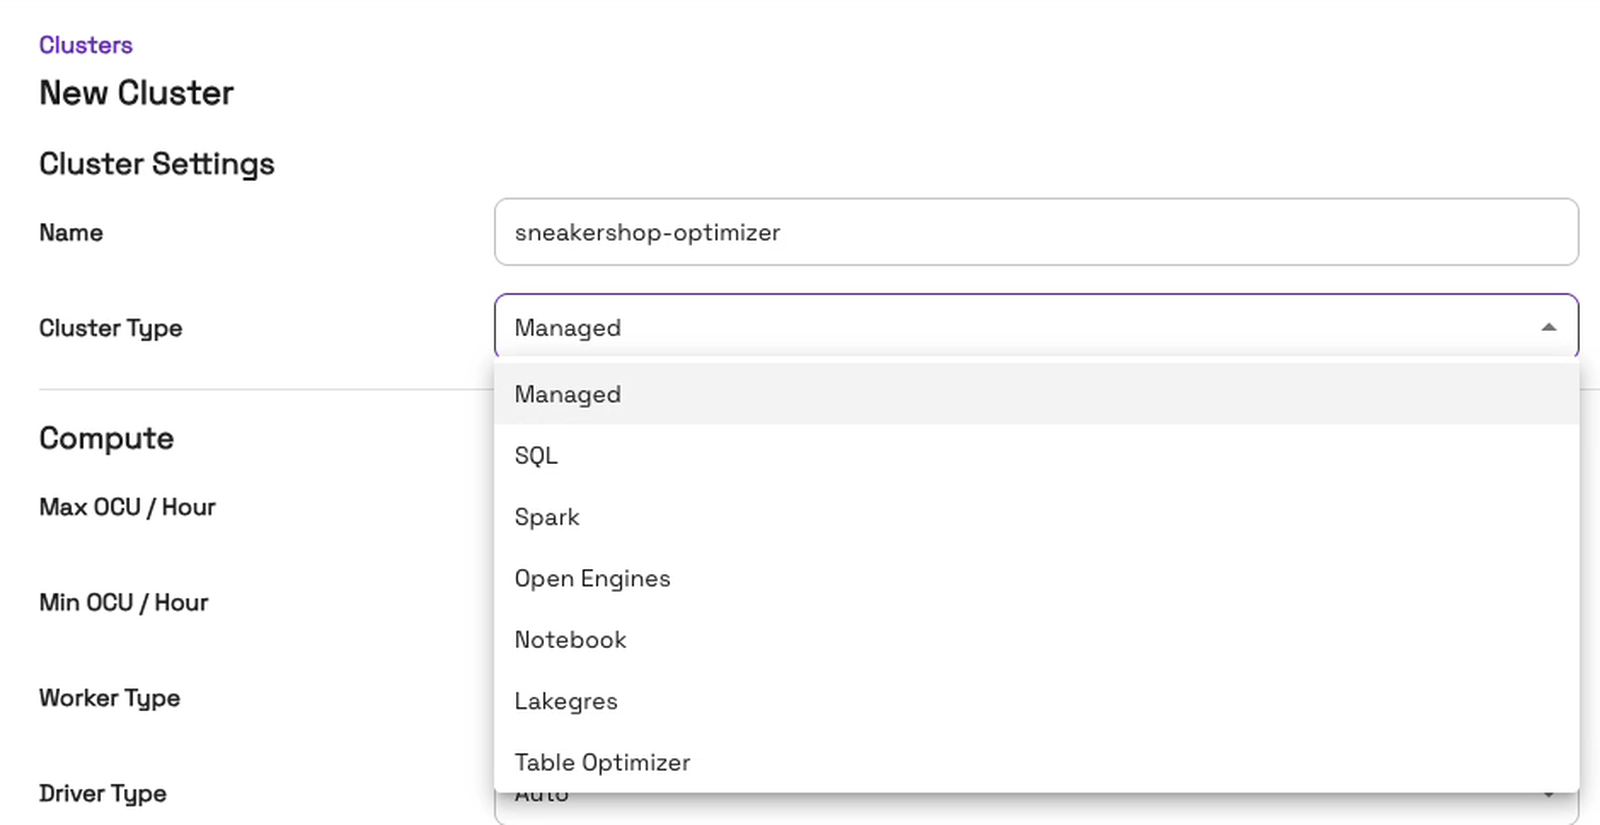
In the console, open “Clusters” and add a new cluster. On the New Cluster page, we name the cluster sneakershop-optimizer and open the “Cluster Type” list. “Table Optimizer” is one of the cluster types:
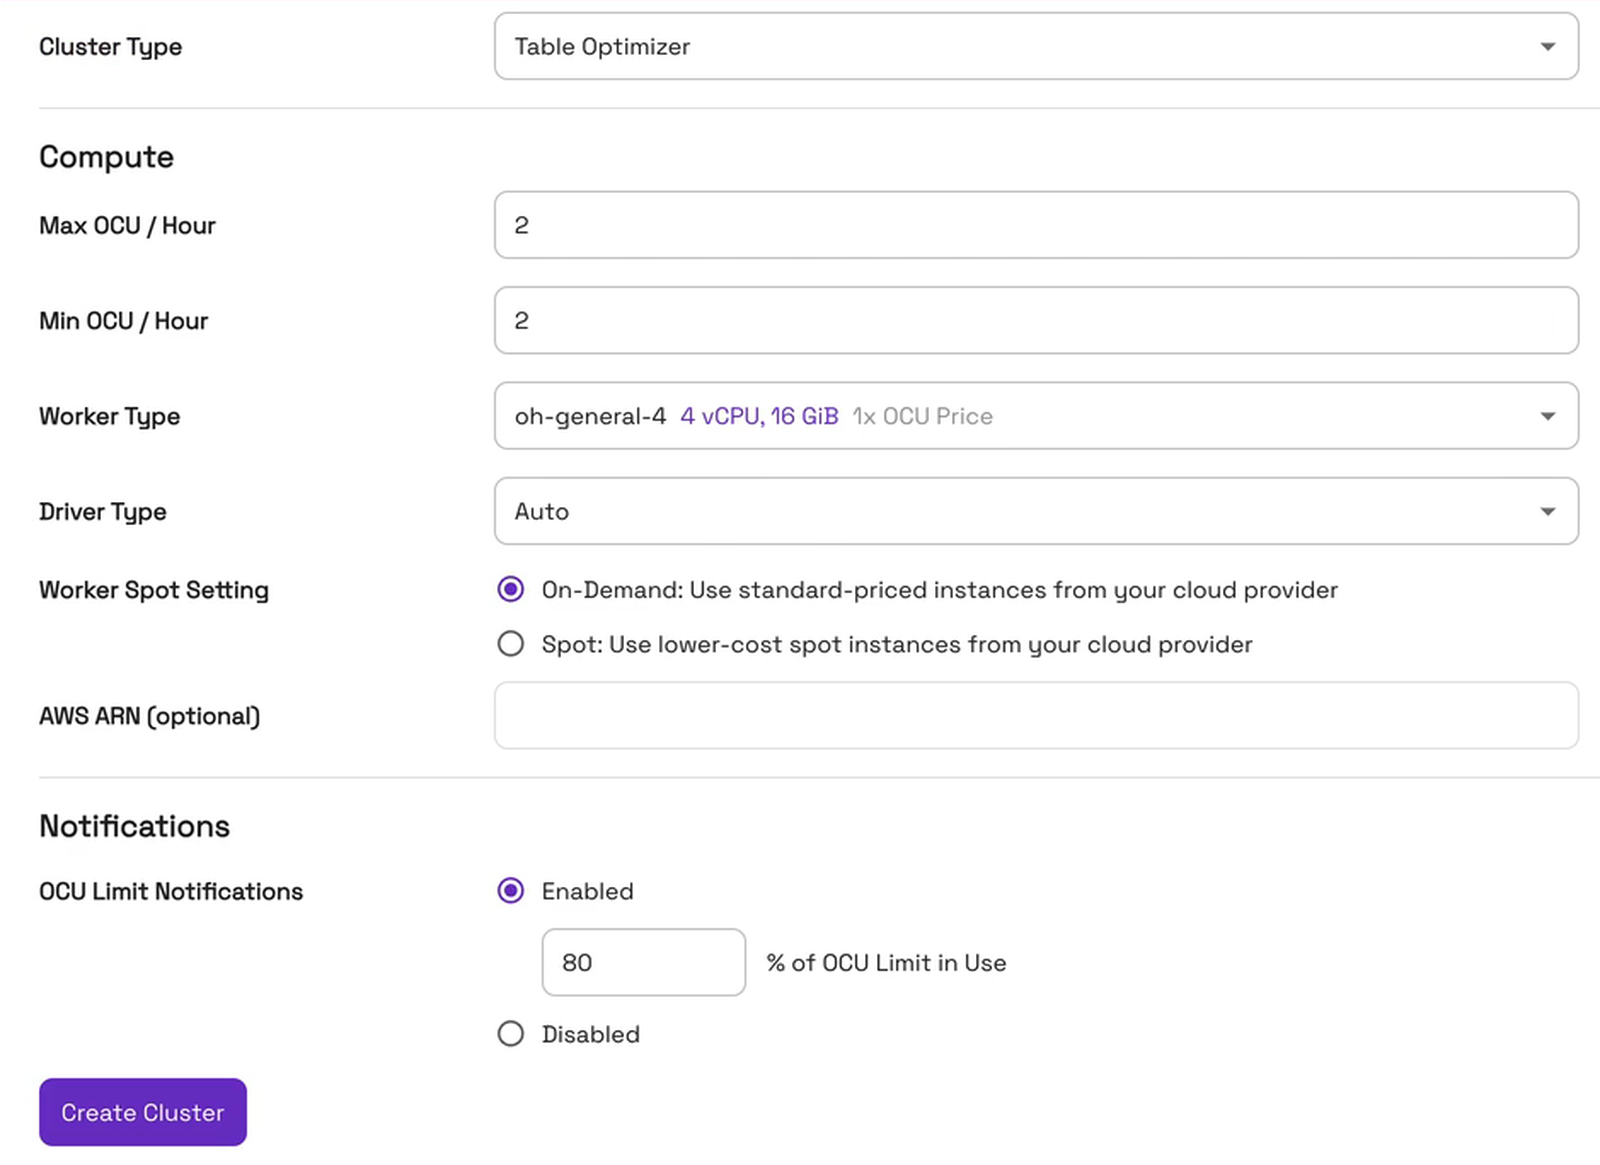
We pick “Table Optimizer” and keep 2 OCU for “Max OCU / Hour” and “Min OCU / Hour”. Under “Worker Spot Setting”, we pick “On-Demand”. Then we click “Create Cluster”:
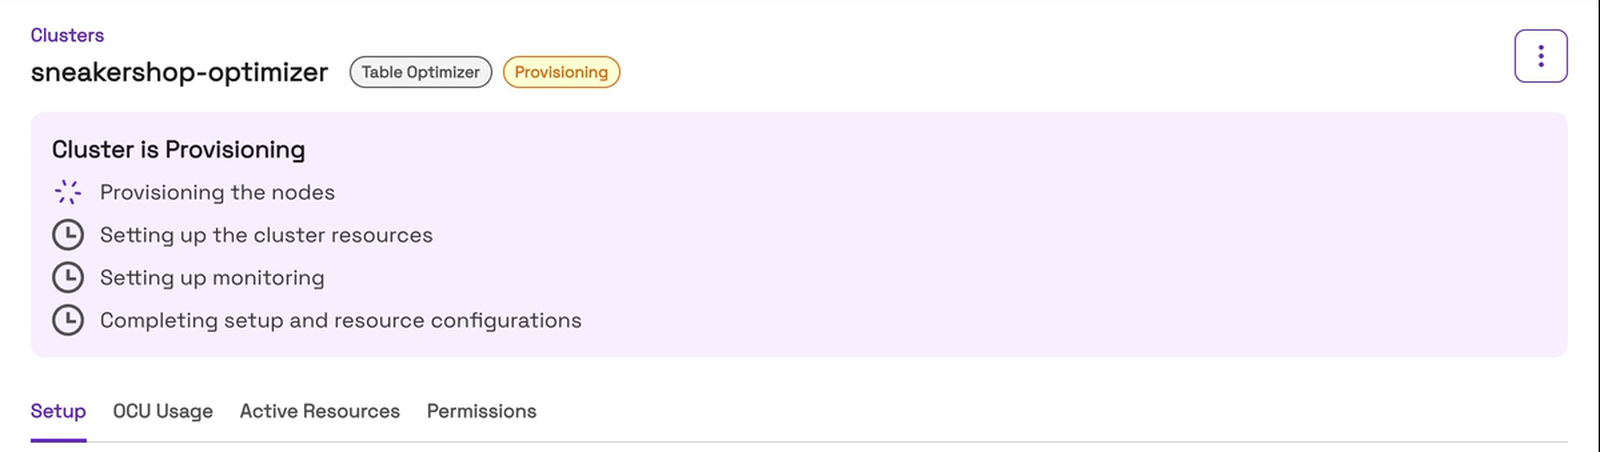
The new cluster starts in “Provisioning” while Onehouse sets it up:
Step 2: Create an observed lake
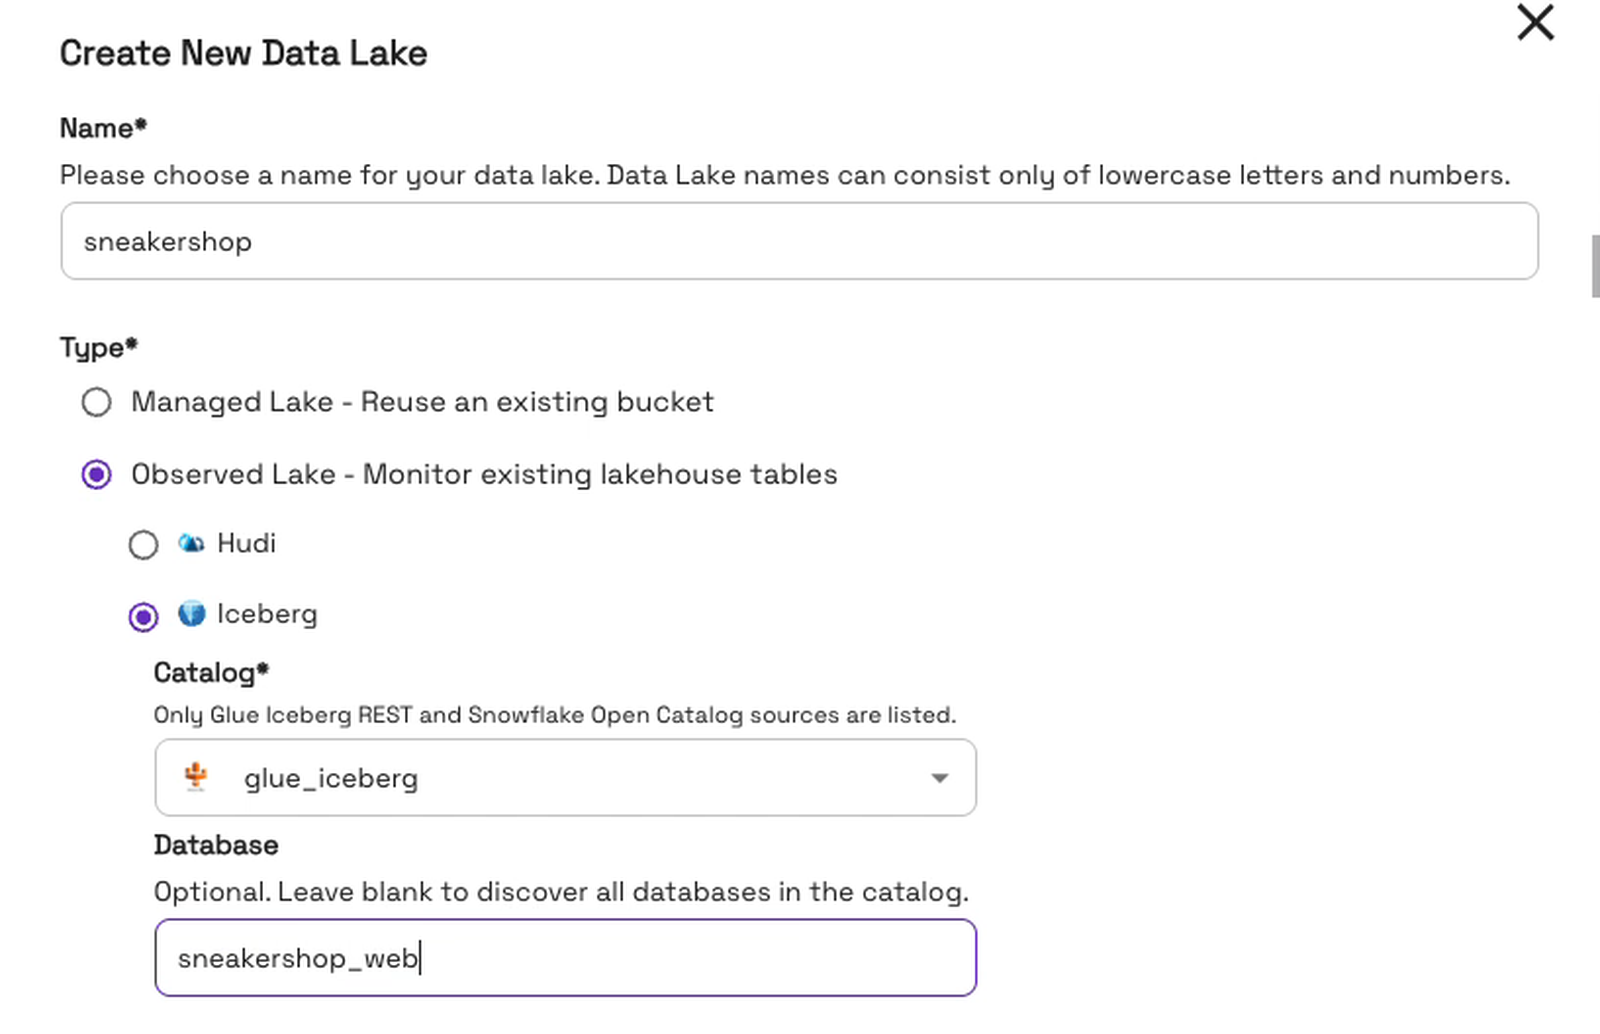
Open “Data” and create a lake. In the “Create New Data Lake” form, we name the lake sneakershop. Under “Type”, we pick “Observed Lake - Monitor existing lakehouse tables”, then “Iceberg”. Under “Catalog”, we pick our Glue Iceberg REST catalog, glue_iceberg. Under “Database”, we enter sneakershop_web, so Onehouse looks only in that database:
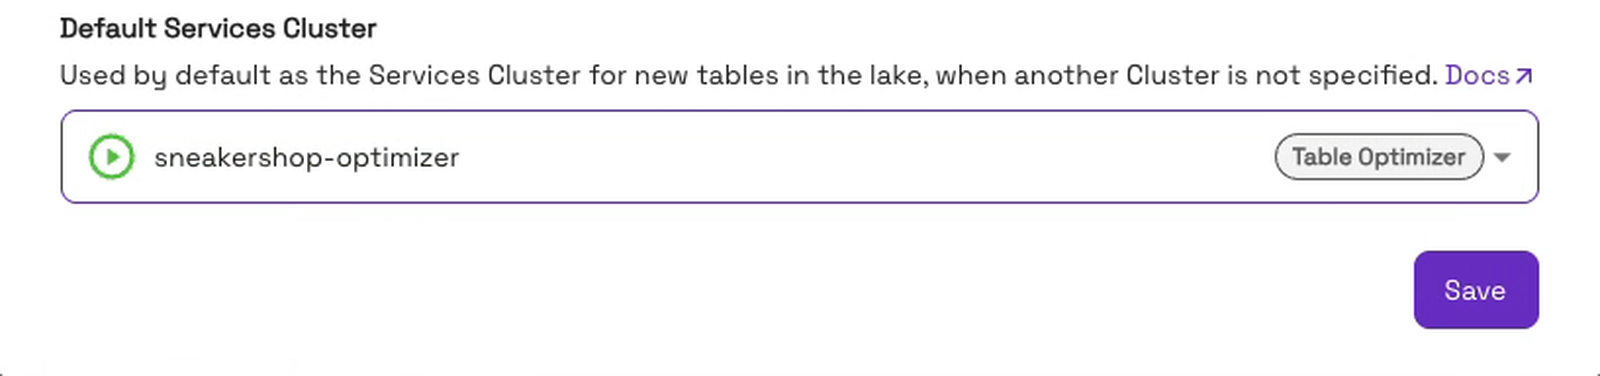
Further down, under “Default Services Cluster”, we pick our Table Optimizer cluster, sneakershop-optimizer. Then we click “Save”:
Onehouse works on the table in place, through its catalog. It doesn’t move the table or copy it anywhere else. To optimize it, Onehouse writes the new, bigger files next to the old ones and commits them to the same table. So, although the console calls the lake “Observed”, Onehouse needs write access to the table.
Step 3: Check that Onehouse finds the table
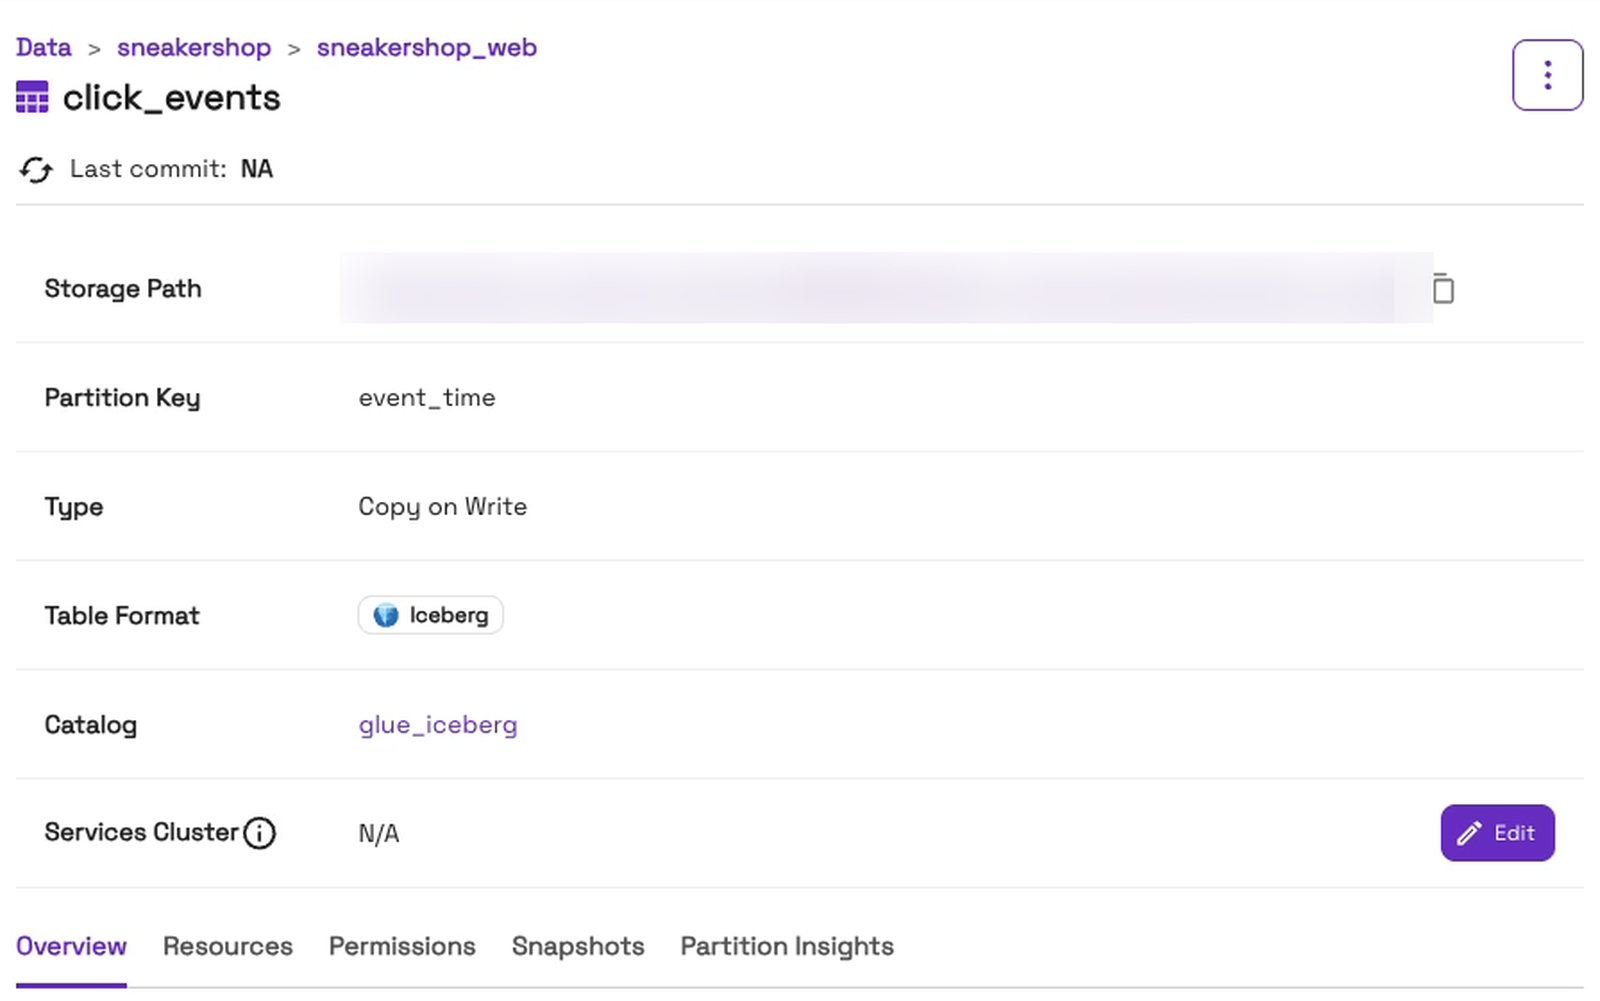
Onehouse discovers the tables in the catalog. A few minutes after we saved the lake, our table was there: open “Data”, then the lake sneakershop, the database sneakershop_web and the table click_events. The table page shows “Table Format” Iceberg and “Catalog” glue_iceberg:
Step 4: Turn on clustering
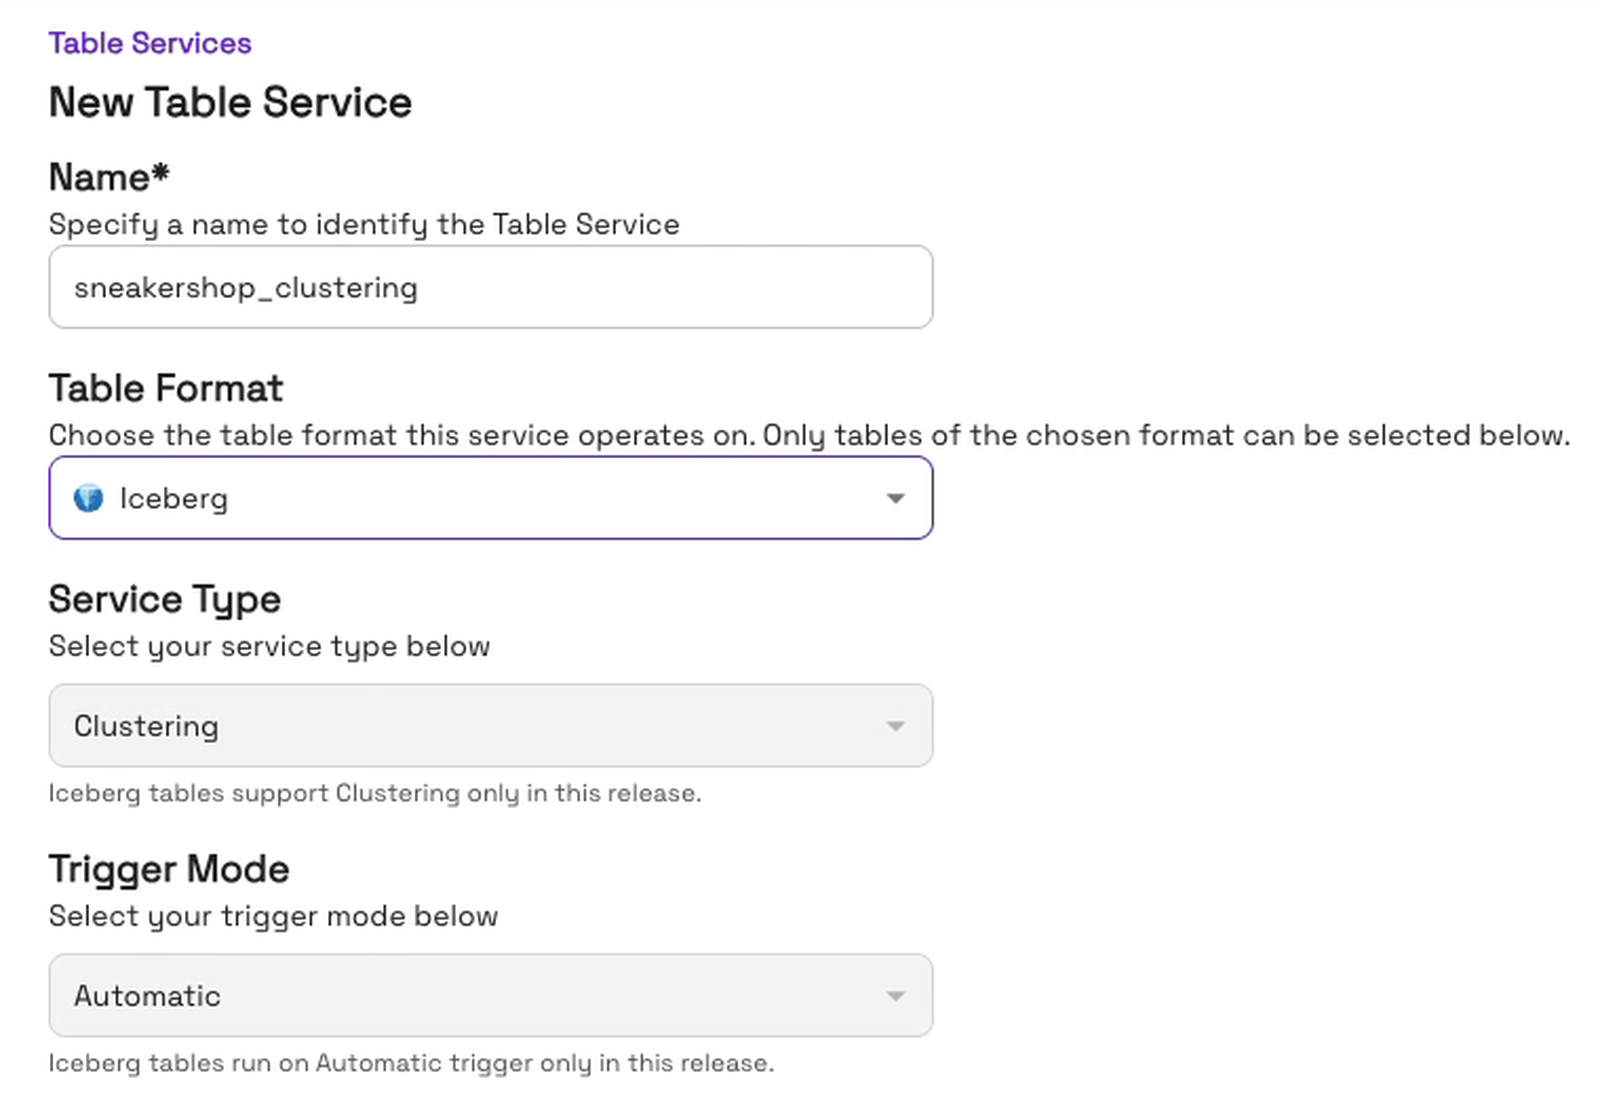
Open “Table Services” and add a table service. We name the service sneakershop_clustering and pick “Iceberg” as the “Table Format”. For Iceberg tables, the form sets “Service Type” to “Clustering” and “Trigger Mode” to “Automatic”. The notes under both fields say so:
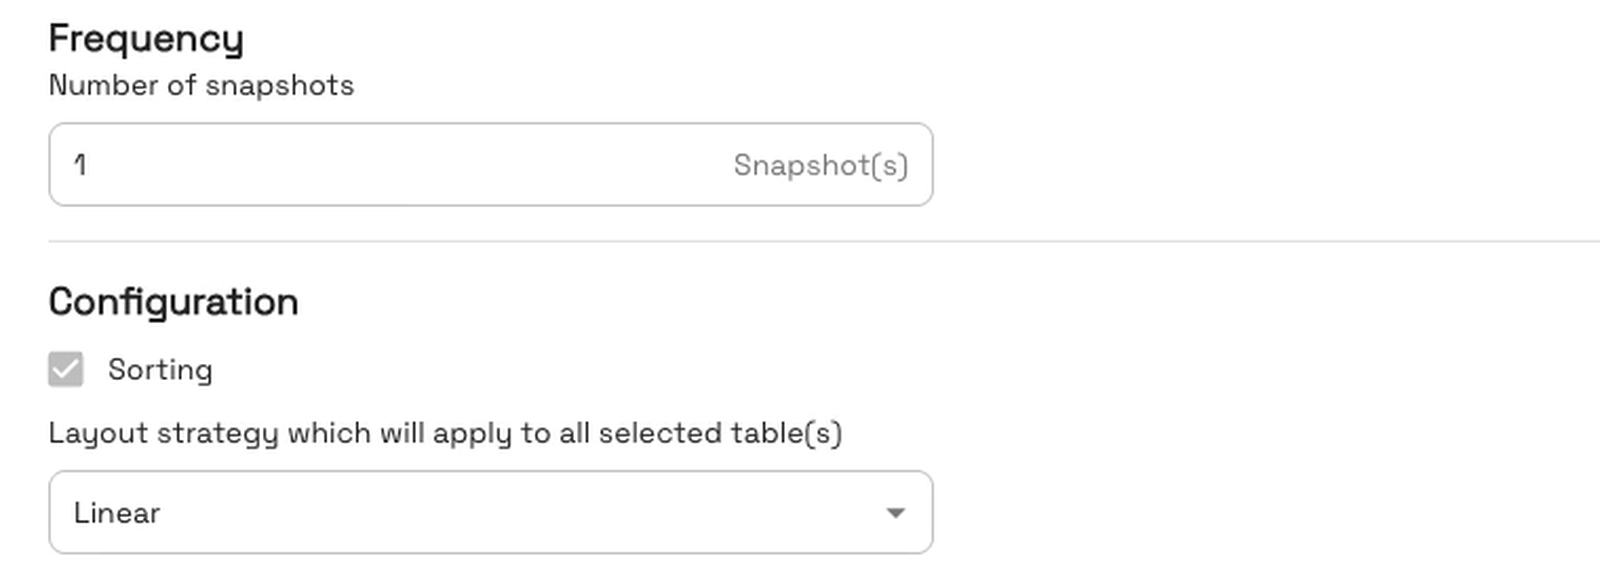
Under “Frequency”, we set “Number of snapshots” to 1, so Onehouse plans a clustering run after every new snapshot of the table. We used 1 to show the behavior quickly. On a busy table, pick a higher number. Under “Configuration”, “Sorting” is on. We keep the “Linear” layout strategy, because we sort on one column:
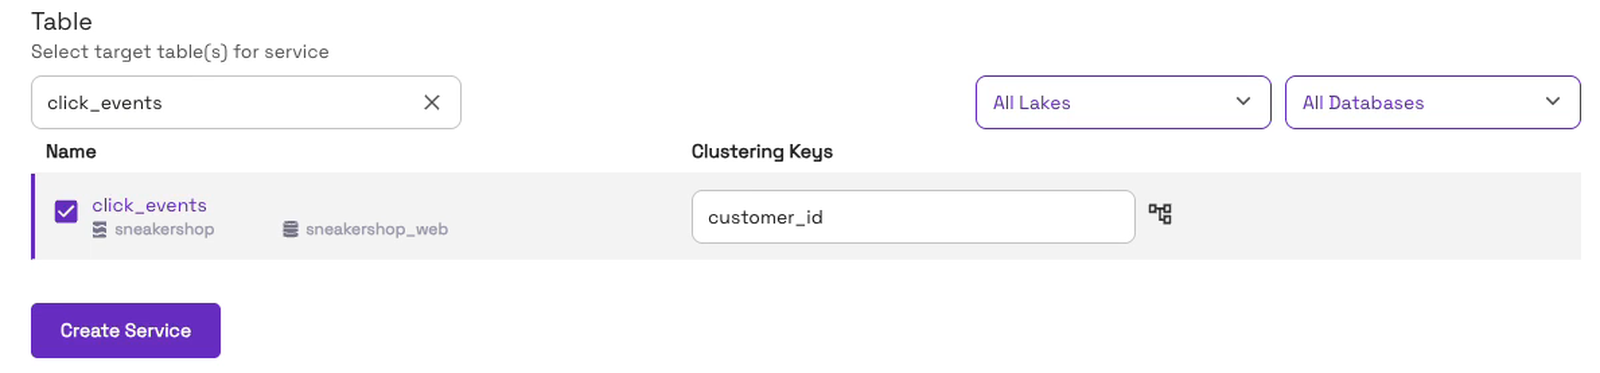
Under “Table”, we search for click_events and tick it. The row shows its lake, sneakershop, and its database, sneakershop_web. Under “Clustering Keys”, we set customer_id, because that is the column our query filters on. Then we click “Create Service”:
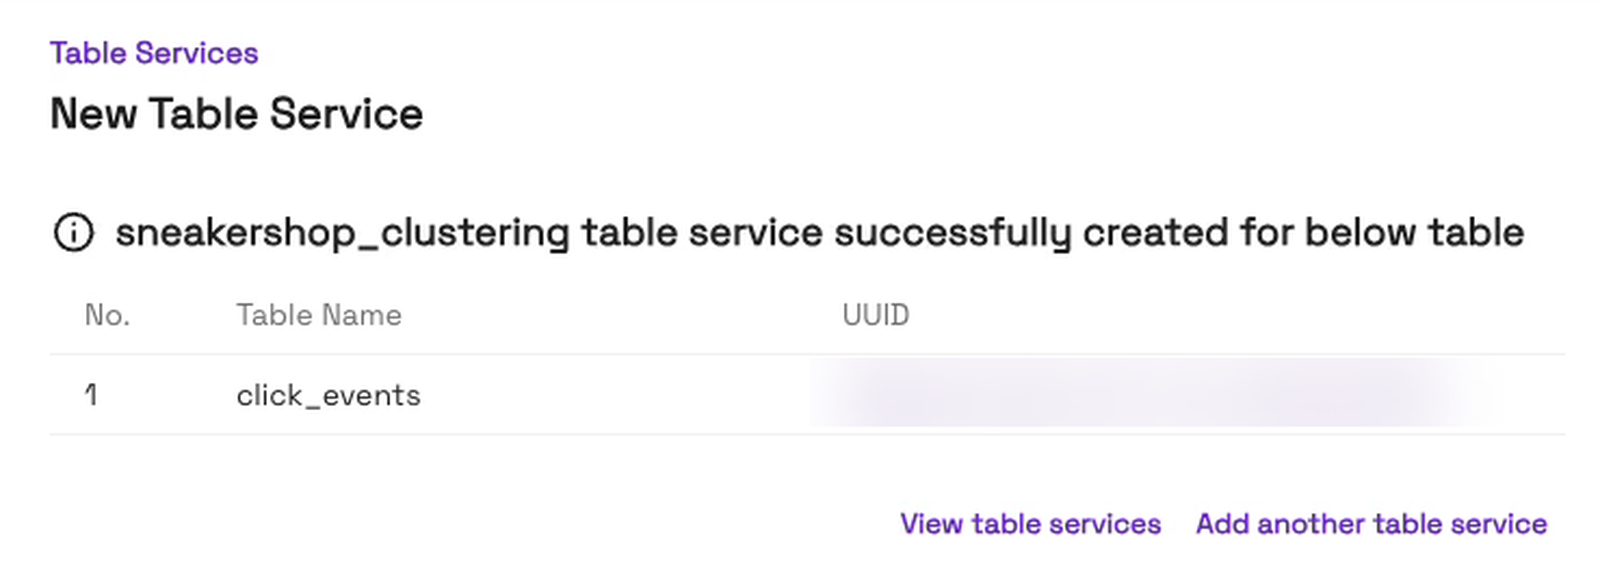
The console confirms that the service exists for click_events:
Clustering does two things: it merges the small files into one bigger file per day, so the query opens 28 files instead of 2,000, and it sorts each file by customer_id, so the engine can skip the parts of each file that don’t hold that customer.
What did clustering change?
Table Optimizer ran by itself
After we created the service, we didn’t press anything. To see what Table Optimizer did, open the table and go to its “Snapshots” tab. The list shows the table’s snapshots, newest first:
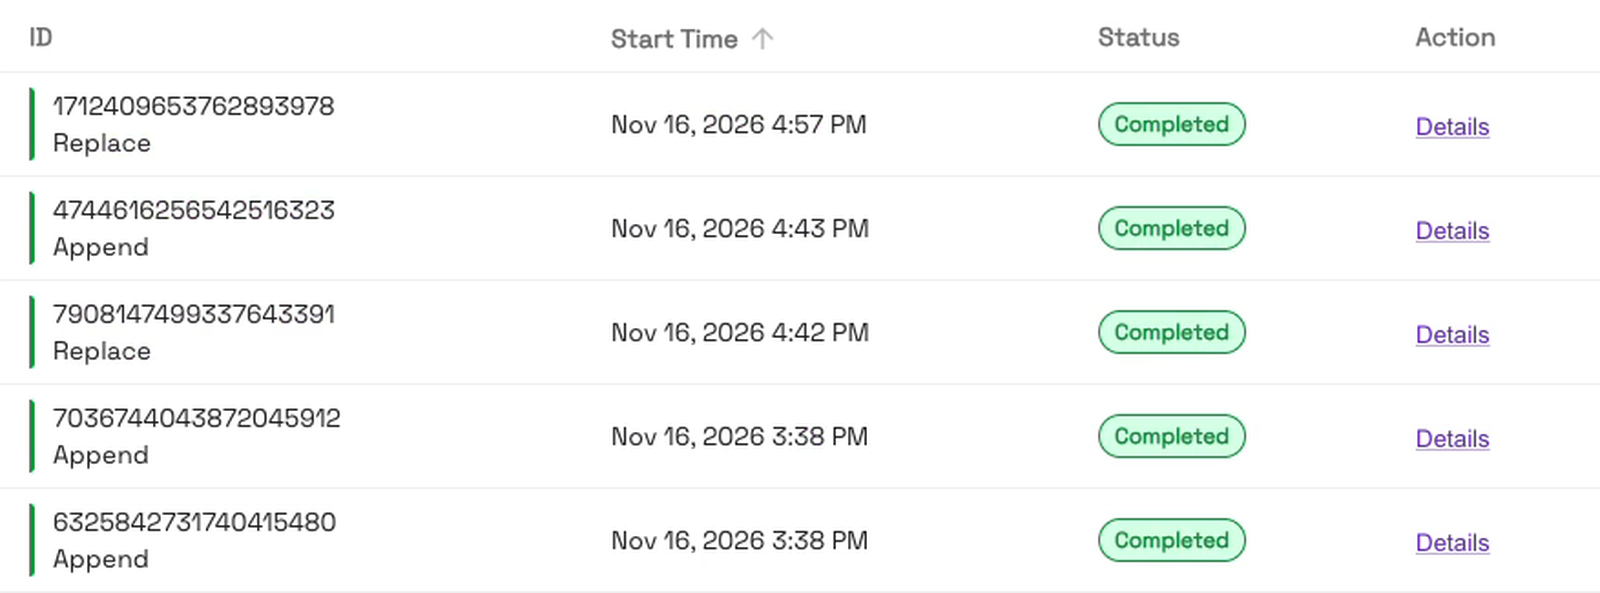
Read the list from the bottom up. “Start Time” is when each operation started.
- 3:38 PM, Append: the last two of the 100 small batches that built the table.
- 4:42 PM, Replace: Table Optimizer’s first run. It started about three minutes after we created the service. It packed the 2,000 small files into 28 and finished at about 4:46 PM.
- 4:43 PM, Append: while the first run was working, 10 more small files landed.
- 4:57 PM, Replace: a second automatic run packed those 10 new files into that day’s file. The table ended with 28 files.
The numbers
Here is the table before clustering and after both runs, from the table’s Iceberg metadata:
| Before clustering | After clustering | |
|---|---|---|
| Data files | 2,000 | 28, one per day |
| File size | 78–190 KiB | 3.3–14.8 MiB, 6.98 MiB on average |
| Rows | 13,864,689 | 13,946,612: the same rows, plus 81,923 from the 10 new files. None lost. |
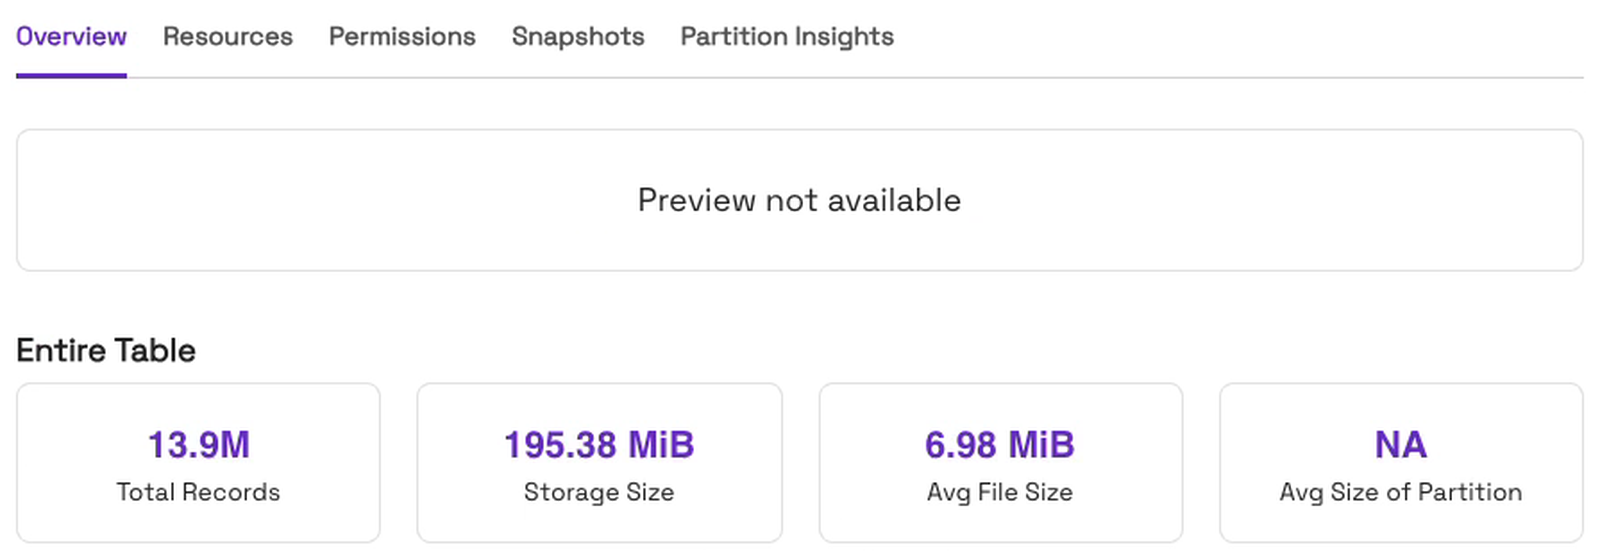
Each day is one partition of the table, so clustering wrote one sorted file per day. The table’s Overview tab shows the same picture: 13.9M total records and an average file size of 6.98 MiB:
How much faster is the query?
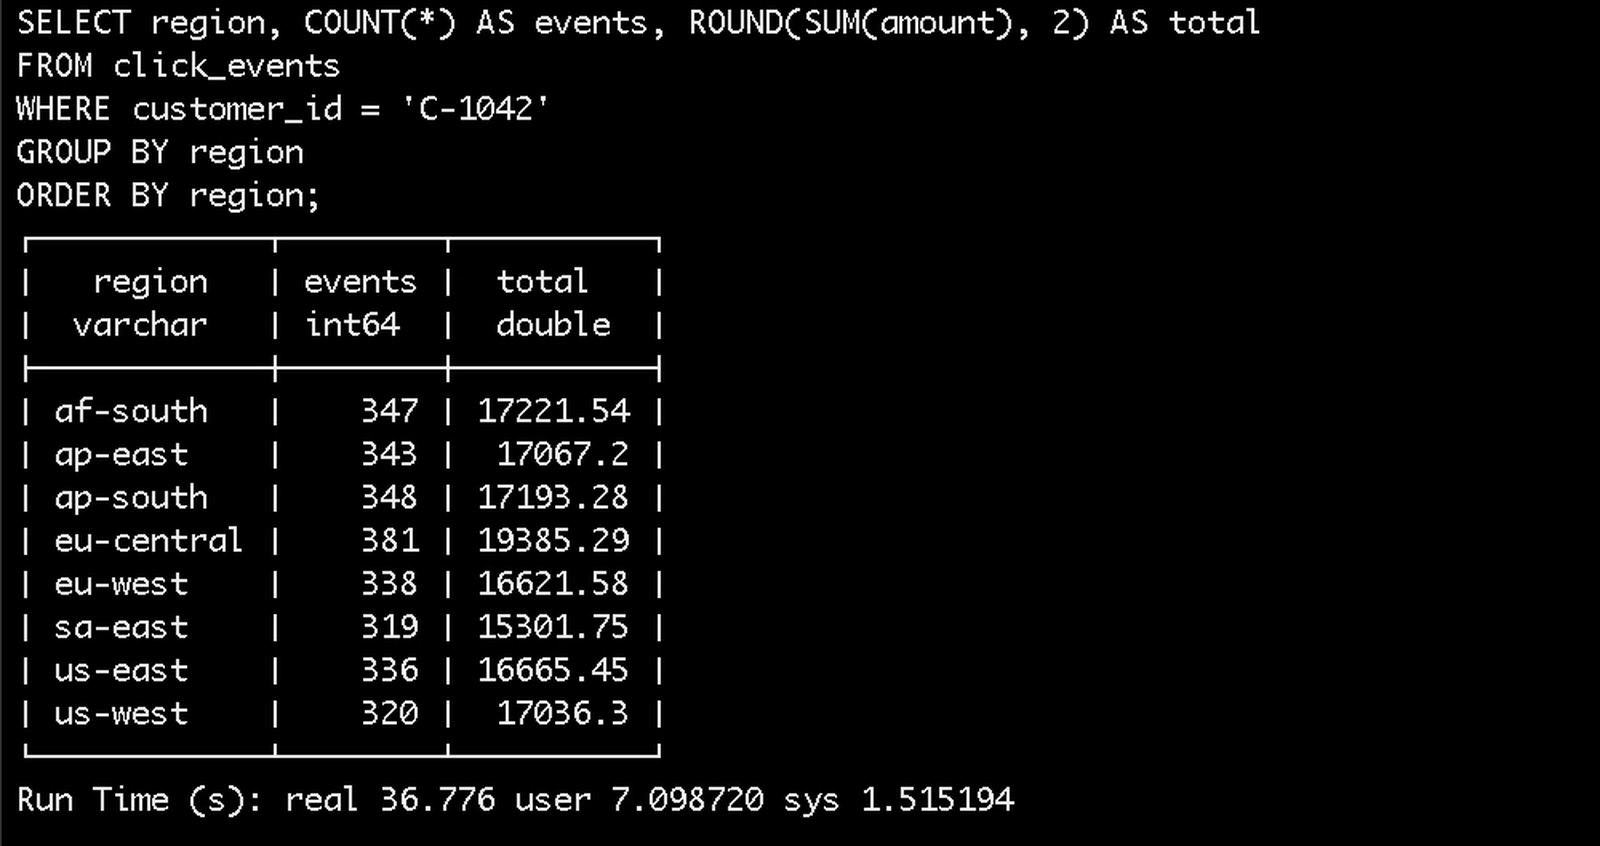
We ran the same DuckDB query from a laptop, reading the table from Amazon S3. It finds one customer’s events across all four weeks:
SELECT region, COUNT(*) AS events, ROUND(SUM(amount), 2) AS total
FROM click_events
WHERE customer_id = 'C-1042'
GROUP BY region
ORDER BY region;
Before clustering, on 2,000 small files, the query took 36.8 seconds:
After clustering, on 28 files, the same query took 8.4 seconds, about 4.4× faster:
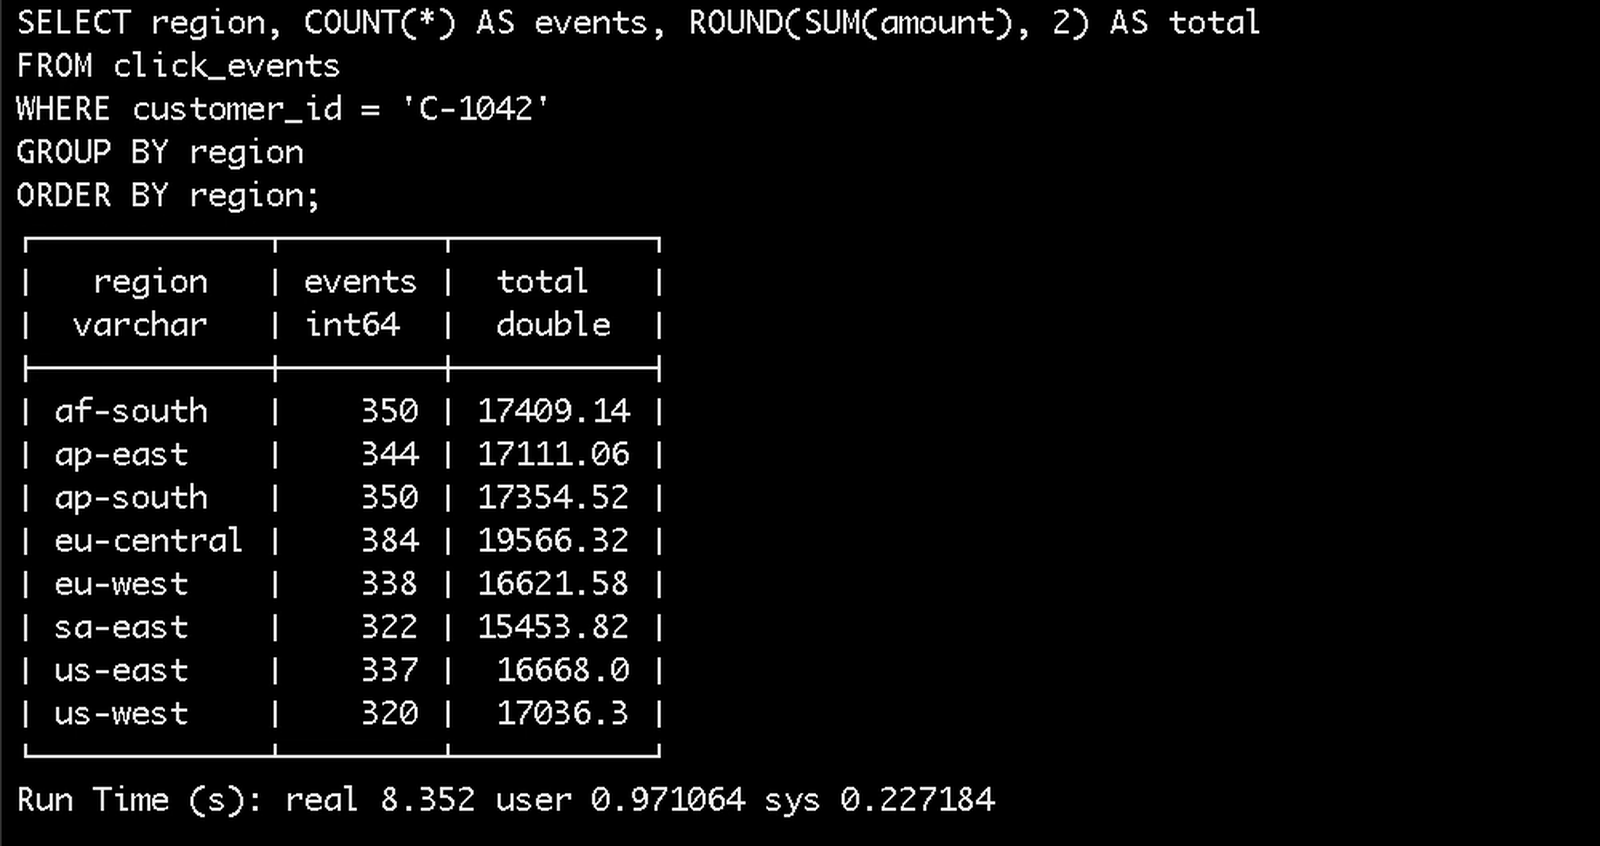
We didn’t change the query, the engine or how the data is written. Only the file layout changed. The “after” query counts a few more events, because it also reads the 10 new small files that landed during the first clustering run.
Things to know before you start
- Clustering on Iceberg runs automatically. There is no run button to press. You choose after how many new snapshots it runs. We used 1 to show the behavior quickly. On a busy table, pick a higher number.
- Pick the sort key that the queries filter on most. Our query filters on
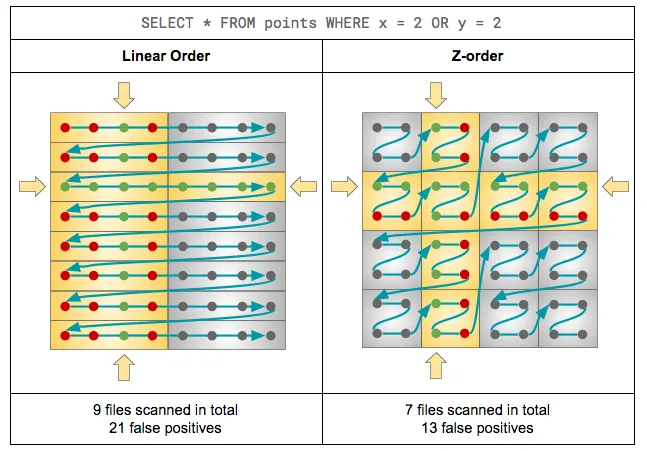
customer_id, so that is our clustering key. - Linear for one column, Z-order for two or more. Onehouse supports both layouts, which match Iceberg’s sort and zorder sort orders. Linear works well for one column, and Z-order helps when the queries filter on two or more.
- Nothing changes in how the data is written or queried. The data keeps landing in small batches. Table Optimizer works on the table in the background, and the engines keep reading the same Iceberg table through its catalog.
- Clustering also re-sizes files. Because
rewrite_data_filesboth sorts and re-sizes, you don’t need a separate compaction service for an Iceberg table. - Clustering doesn’t delete the old small files. They stay in S3 until snapshots are expired, so keep your existing snapshot expiration in place.
Conclusion
In this blog, we’ve fixed a slow Apache Iceberg query caused by small files, with Onehouse Table Optimizer. We added a Table Optimizer cluster, an observed lake and one clustering service in the console. Onehouse worked on the table in place, through its catalog. It didn’t move or copy the table: it wrote the new, bigger files next to the old ones and committed them to the same table. Table Optimizer then ran by itself: 2,000 small files became 28, with no rows lost, and the same query went from 36.8 seconds to 8.4 seconds.
Other recommended blogs:
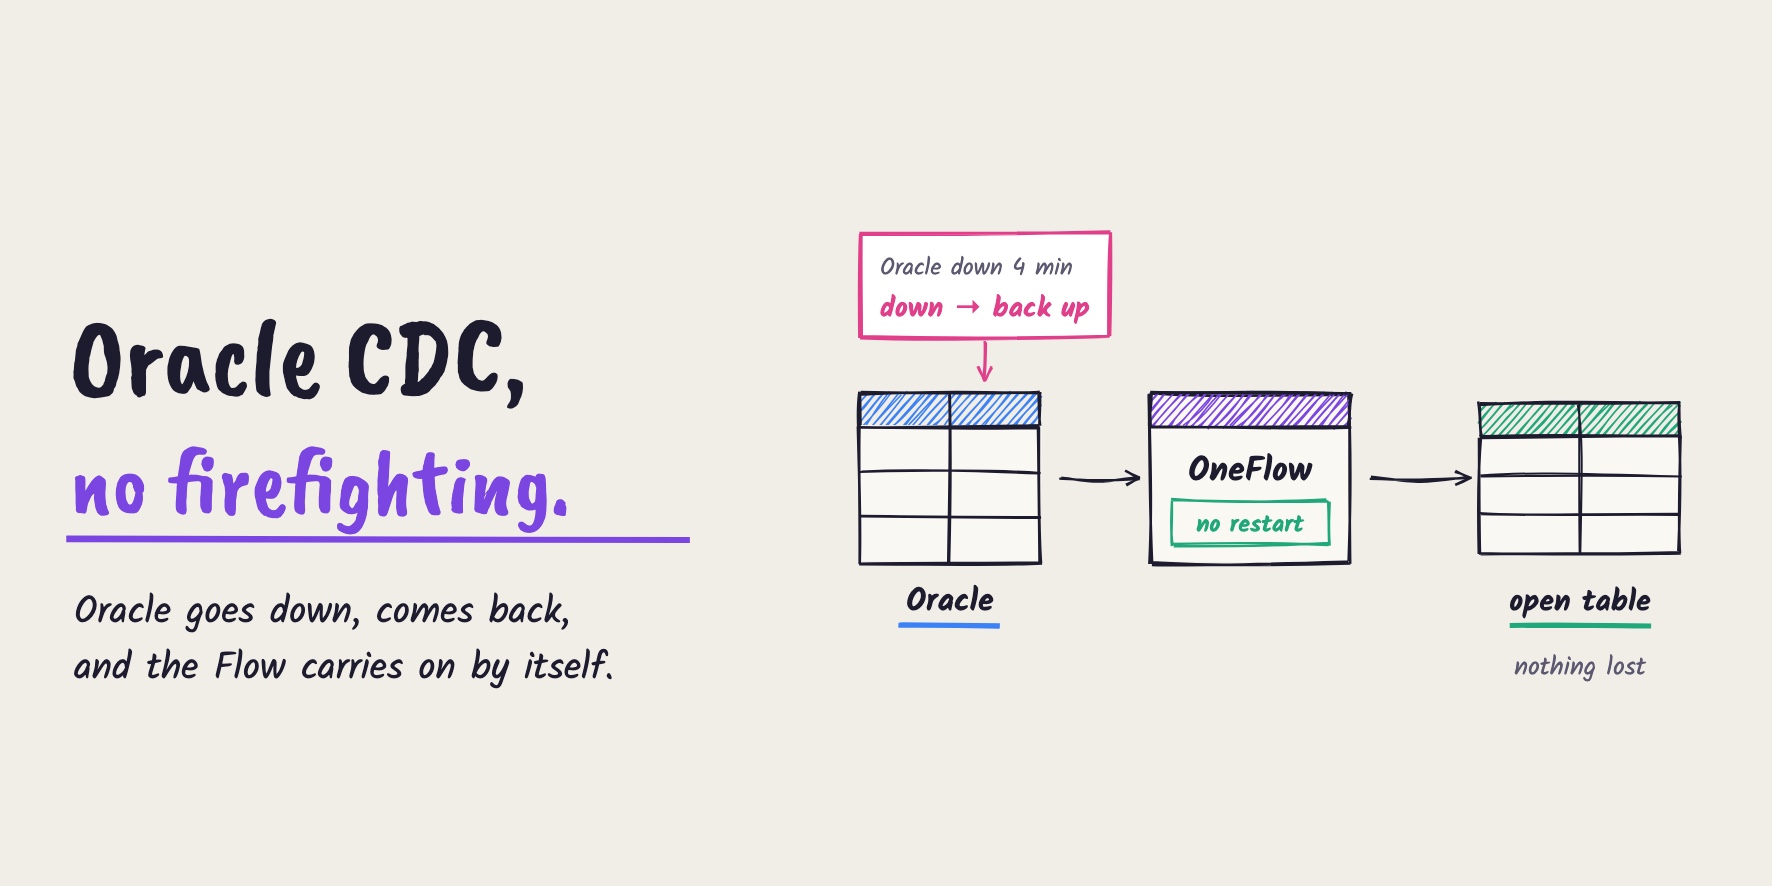
- Near real-time Oracle CDC, without pipeline firefighting
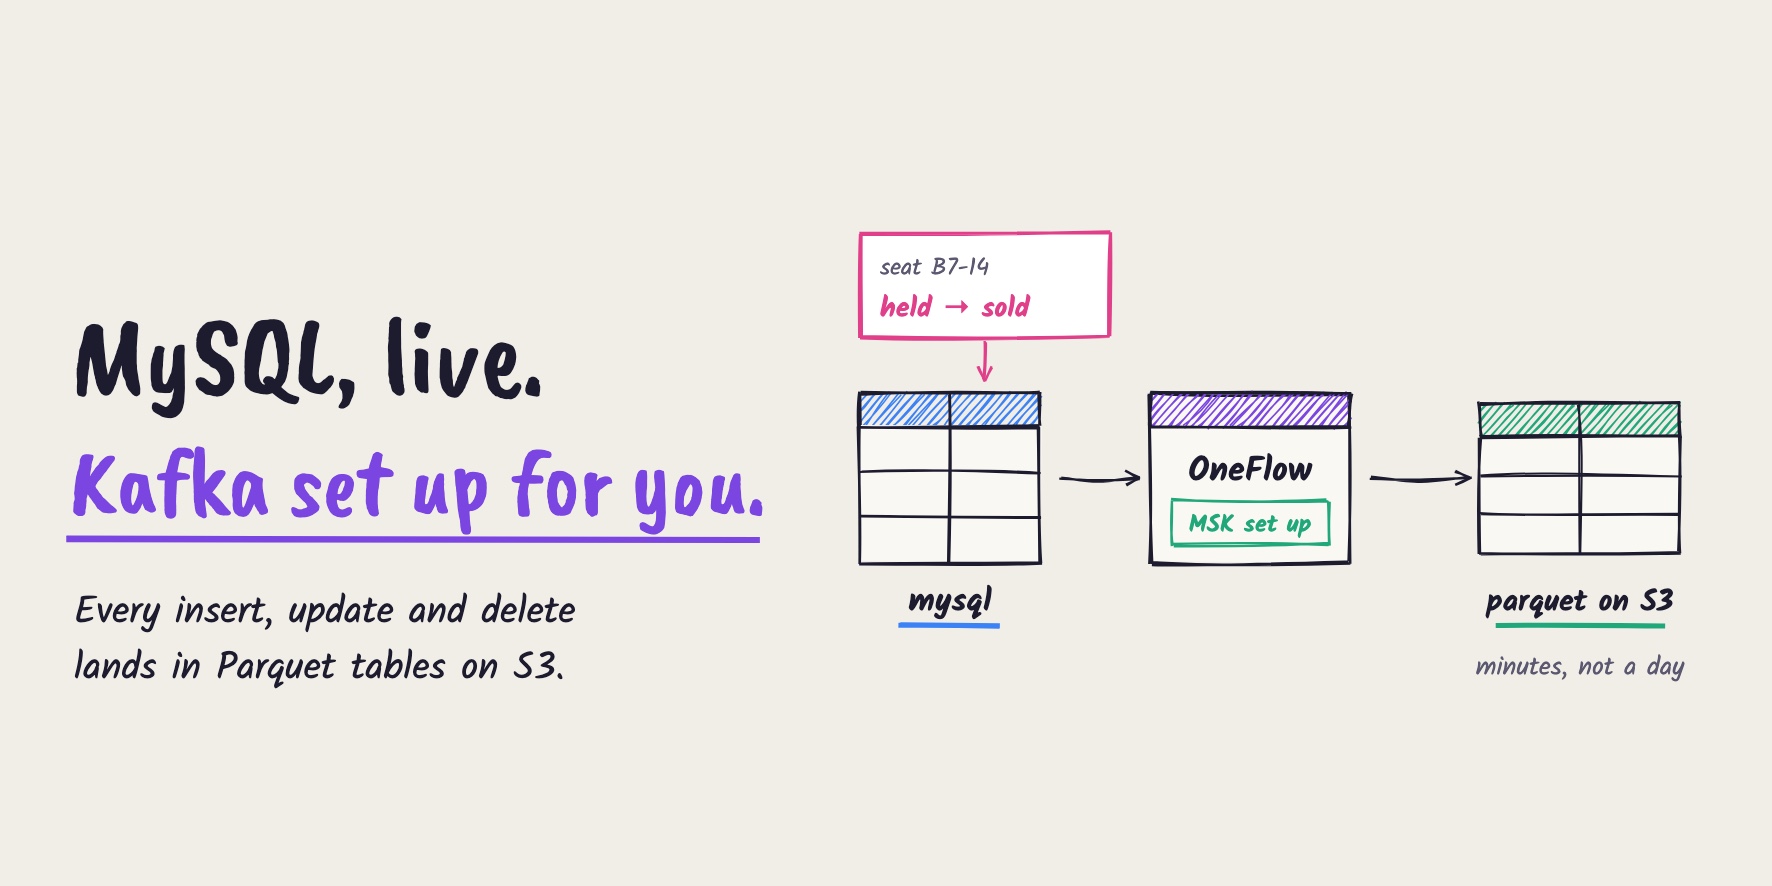
- MySQL CDC to Parquet tables on S3, with Kafka set up for you
To try it on your own tables, start at onehouse.ai, or get in touch with our team at gtm@onehouse.ai.
Frequently asked questions
What is the small files problem in Apache Iceberg?
When data lands in small, frequent batches, each batch adds a few small data files. Over time, a table can hold thousands of files of a few hundred kilobytes each. Every query has to open many of them, so queries get slow, even when the data itself is small.
What is Onehouse Table Optimizer?
Table Optimizer keeps tables fast to query. It clusters them as data lands and runs table upkeep in the background, also on tables that other engines write. In the console, it is a cluster type that only runs table services for observed Apache Iceberg tables. It doesn’t run Flows, jobs or queries.
Does Table Optimizer move or copy my Iceberg table?
No. Onehouse works on the table in place, through its catalog. It doesn’t move the table or copy it anywhere else. To optimize it, Onehouse writes the new, bigger files next to the old ones and commits them to the same table. So it needs write access to the table’s storage and catalog, not only read access. Other engines keep reading the same table.
When does clustering run?
On Iceberg tables, clustering runs on the Automatic trigger, after a set number of new snapshots. With 1, Onehouse plans a run after every new snapshot. We used 1 to show the behavior quickly. On a busy table, pick a higher number. In our run, the first run started about three minutes after we created the service.
Which catalogs can an observed Iceberg lake use?
The lake form lists Glue Iceberg REST and Snowflake Open Catalog catalogs. We used a Glue Iceberg REST catalog.
Should I use Linear or Z-order?
Linear works well when the queries filter on one column. Z-order helps when they filter on two or more columns.
Do I need a separate compaction service for Iceberg?
No. Clustering on Iceberg uses rewrite_data_files, which both sorts the rows and re-sizes the files.
Do I have to change my writers or my queries?
No. In our run, the data kept landing in small batches, and the query didn’t change. Only the file layout changed.
Show video transcript
This query reads one customer's events from the past four weeks from an Apache Iceberg table. It takes about thirty-seven seconds. Let's see how we can optimize the same query on the same table to be faster - without any change to the query itself.
So… why does the query become slow? The cause is… small files, accumulated over time. When data lands in small, frequent batches, each batch adds a few small files. After a while, this table holds about two thousand files - most of them just a hundred kilobytes or so each. And every incoming query - regardless of what query engine gets used - has to open them all until it finds the right data.
Data arrives across four weeks, in crests and troughs. On the sale day, we see more visits.
Usually, the fix is to employ a rewrite job that merges these small files into larger chunks. Now the job must be sized up and run on a schedule - all while the data lands dynamically. A Table Optimizer does exactly that - working on the table in the background, and it keeps working as fresh data arrives.
We start with an Apache Iceberg table in the AWS Glue Data Catalog. Its Glue Iceberg REST catalog is already connected to Onehouse.
First, we add a Table Optimizer cluster. It is a cluster type available on Onehouse that only does the table upkeep for Iceberg tables. It doesn't run queries or jobs.
Next, we create an observed lake. Onehouse works on the table in place, through its catalog. It doesn't move the table or copy it anywhere else. To optimize it, Onehouse writes the new, bigger files next to the old ones and commits them to the same table. We pick Iceberg - for the lake type, followed by the Glue catalog and the database; and we let the Table Optimizer cluster run the services for this lake.
Onehouse discovers the table in the catalog.
Now we turn on clustering from the Table Services section on the console. We give the service a name, and pick Iceberg as the table format. On Iceberg tables, the service is clustering, and it runs automatically. It runs after a set number of new snapshots. We choose one, to show it quickly. On a busy table, pick a higher number. We keep the Linear layout, because we sort on one column. Next, we pick our table, click_events. We sort by customer ID, because that is the column the query filters on. Then we create the service. Clustering merges the small files into one bigger file per day, so the query opens twenty-eight files instead of two thousand. And it sorts each file by customer ID, so the engine can skip the parts of each file that don't hold that customer.
When new data lands, Table Optimizer runs by itself. A new snapshot in the table's history shows the rewrite.
The table service we configured merged about two thousand small files into twenty-eight bigger ones - one for each day, while ensuring no rows were lost.
Now the same query, on the same table. Earlier, it took about thirty-seven seconds. Now it takes about eight seconds.
A few things to know before you start. Clustering on Iceberg runs automatically, so there is no run button to press. Pick the sort key that the queries filter on most: Linear works well for one column, and Z-order helps when they filter on two or more. Nothing changes in how the data is written or queried.
To try it on your own tables, start at onehouse.ai.