Talk with our engineers by joining the new Onehouse community Slack!
TL;DR
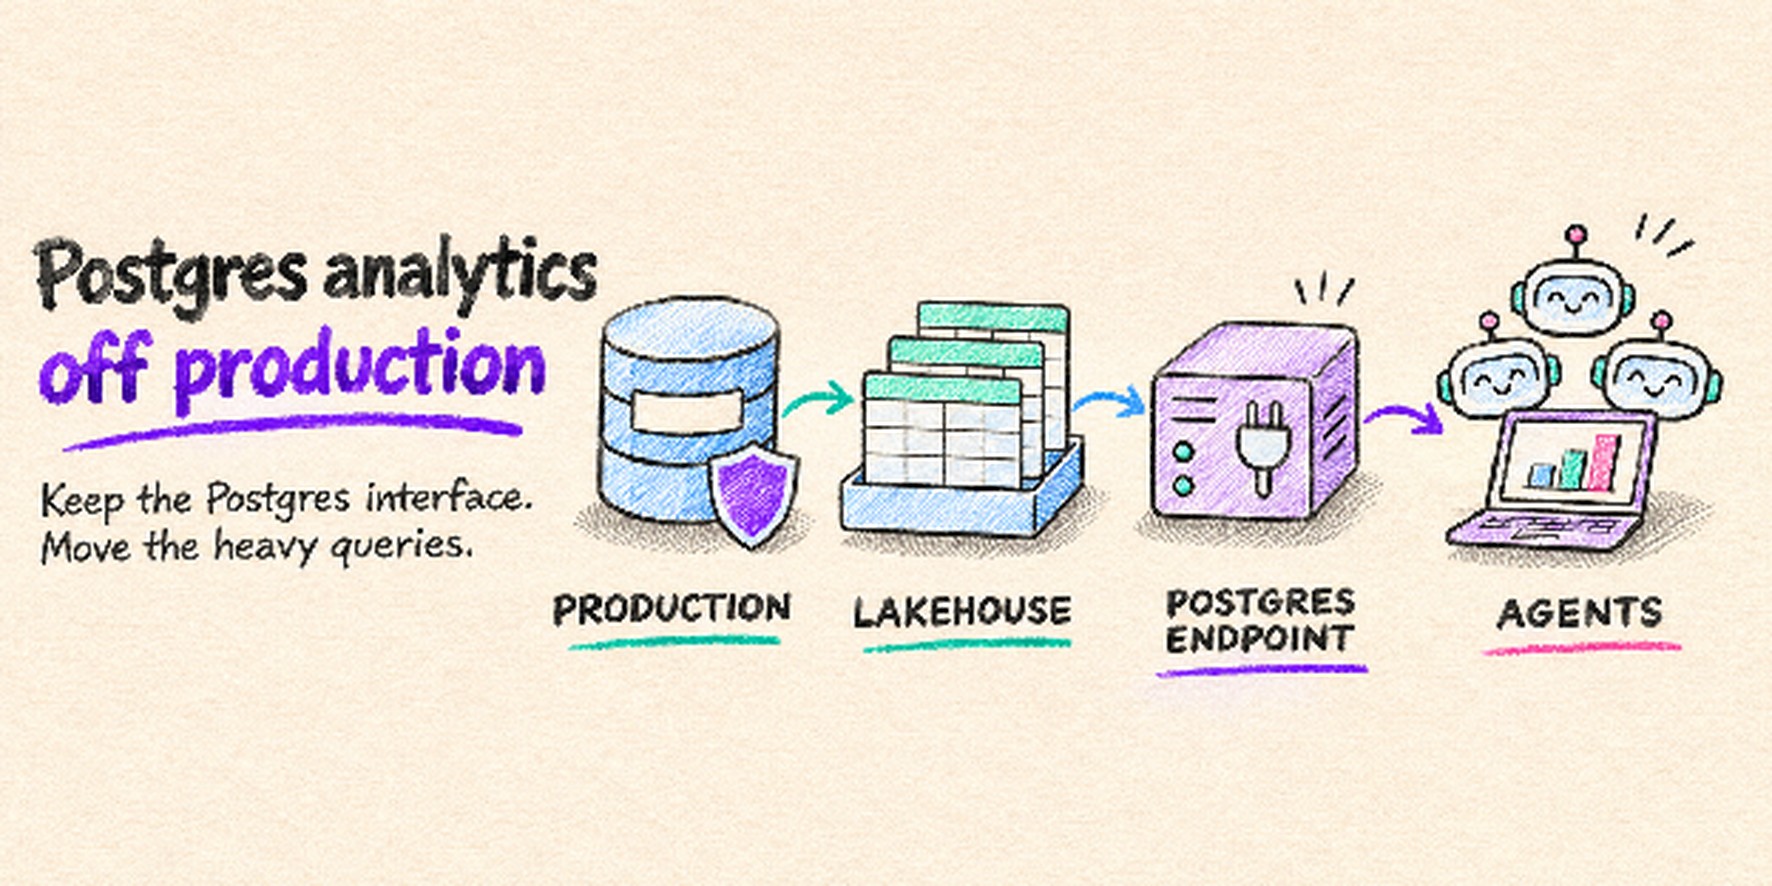
Postgres can handle analytics when query latency and application performance remain within budget. Tuning, materialized views and read replicas can extend that range. When heavy reads outgrow it, replicate the data to separate compute. Lakegres queries open lakehouse tables through the Postgres wire protocol; validate SQL compatibility before moving clients. Production continues serving the application and feeding replication.
Postgres can serve analytics while those queries meet latency targets without disrupting application traffic. As scans and concurrent reads compete with transactions, move them to separate compute. A read replica is one option; a lakehouse serving layer such as Lakegres also changes how those queries execute.
Postgres analytics means running aggregations, joins and reporting queries on PostgreSQL, often on the same database that serves the application. The limit depends on query shape, concurrency and the resources available alongside application traffic. Agents can increase concurrency by generating repeated queries within a task.
Can Postgres handle analytics?
Yes. Its suitability depends on query shape, concurrency, data size and the resources available alongside application traffic.
Postgres has a mature planner, window functions, CTEs and parallel query, and BI tools such as Tableau, Power BI and Looker connect to it out of the box. The limits come from how Postgres stores and executes data.
What Postgres does well for analytics
Postgres is a strong choice when the analytical dataset fits comfortably on one server and the queries are selective. Selective queries can use indexes to avoid scanning entire tables. B-tree indexes support selective lookups; BRIN indexes can prune page ranges when values correlate with physical row order.
Teams also get one system to operate. Queries on the primary read committed data according to their transaction snapshot, permissions live in one place, and analysts use the same SQL dialect as the application. For an early product or an internal reporting workload, those advantages outweigh raw scan speed.
Where the row store slows analytical queries
Postgres stores rows as heap tuples, with a fixed header that occupies 23 bytes on most machines. Large field values can be stored out of line. A heap scan reads pages containing rows, including columns the query does not need. For scans over a few columns in a wide table, columnar storage can reduce the bytes read and decompressed. Postgres can avoid heap access with index-only scans when the index covers the query and the visibility information permits it.
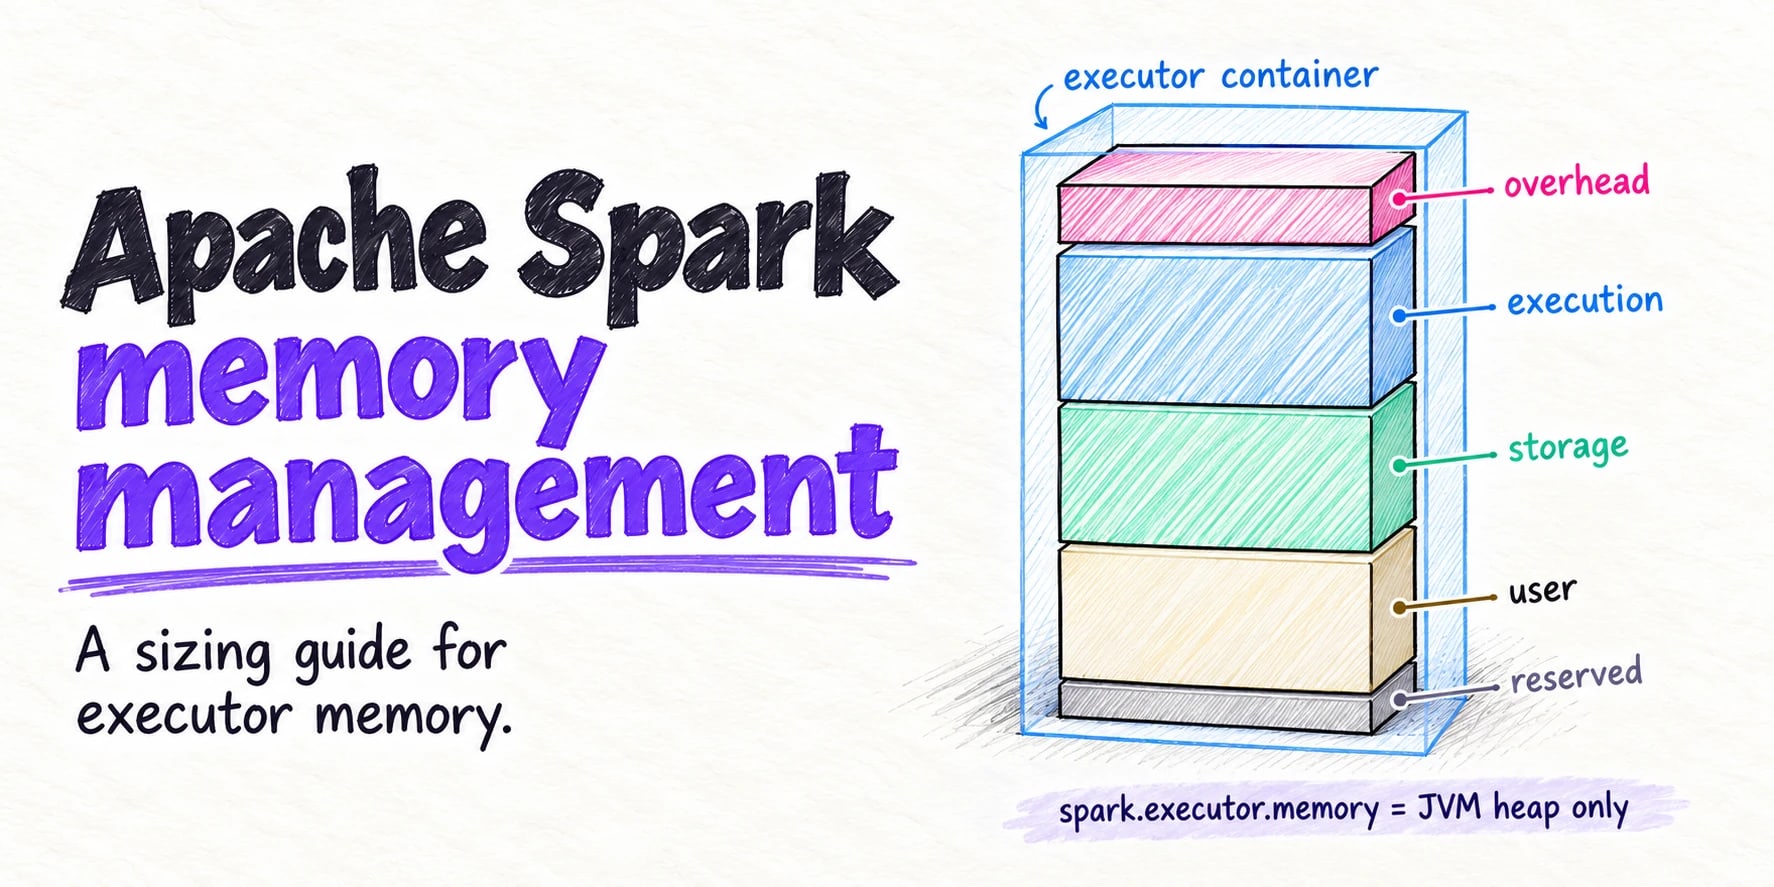
Execution adds a second limit. By default, a single parallel query node starts at most two workers (max_parallel_workers_per_gather defaults to 2), and work_mem defaults to 4 MB per sort operation. Hash operations use work_mem multiplied by hash_mem_multiplier, which defaults to 2.0. Parallel workers and concurrent operations can multiply total memory use, as described in the Postgres resource settings docs.
Higher limits can reduce spills and speed up an individual query. Under concurrency, they can also increase memory pressure and compete with application traffic.
How to tune Postgres for analytics queries
Tuning does not change the row store, but it gets more from it and limits the damage a heavy query can do. Two levers matter most: the settings analytical sessions run with, and how much work each query has to repeat.
Settings for analytical sessions
Give analytics its own database role and tune its session defaults. More memory can reduce spills, parallel workers can spread eligible scans across cores, and statement_timeout bounds query duration. The following values are illustrative; test them against available memory and expected concurrency:
CREATE ROLE analytics LOGIN;
ALTER ROLE analytics SET work_mem = '64MB';
ALTER ROLE analytics SET max_parallel_workers_per_gather = 4;
ALTER ROLE analytics SET statement_timeout = '60s';
ALTER ROLE analytics SET default_transaction_read_only = on;
These settings are defaults. Enforce SELECT-only access to the intended schemas and tables through database privileges, and review inherited roles, object ownership and callable functions. work_mem applies per operation, and hash operations and parallel workers can increase the total. Size it against the connections the role opens, and give analytics a separate connection pool with a limit that reserves capacity for the application. Crunchy Data’s analytics tuning guide walks through each of these settings on a sample dataset.
Pre-aggregate with materialized views and expression indexes
The cheapest analytical query is one that reads a small, precomputed result. A materialized view stores the output of an aggregation, and dashboards read the view instead of rescanning the base tables. Expression indexes can accelerate predicates on computed values. Stored generated columns avoid recomputing a value on reads and can be indexed.
Materialized views trade freshness for speed. A refresh recomputes the whole view, and REFRESH MATERIALIZED VIEW CONCURRENTLY (which keeps the view readable during the refresh) requires a populated view and a unique index on plain columns that covers all rows. Each refresh runs the backing query on the database hosting the view. Frequent refreshes can reduce the savings from precomputation.
Postgres extensions for analytics
Extensions change what Postgres can do without changing the SQL interface. Three target analytical workloads directly, and each solves a different part of the problem.
| Extension | What it changes | Where the heavy query runs |
|---|---|---|
| Citus distributed Postgres | Shards tables and parallelizes queries across nodes | A Postgres cluster you size and operate |
| TimescaleDB time-series extension | Time-partitioned hypertables and continuous aggregates | The Postgres server that holds the hypertables |
| The pg_duckdb extension | Runs analytical queries on DuckDB’s columnar, vectorized engine | Locally in Postgres, or with remote MotherDuck compute |
Project scope as described on each project’s page or README, November 2026. TimescaleDB is developed by Tiger Data (formerly Timescale).
Isolation depends on deployment. Local pg_duckdb execution shares the host’s resources; Citus distributes work across its cluster, and pg_duckdb can use MotherDuck compute. Check whether analytical execution still competes with application traffic.
Read replicas for Postgres analytics: What they fix and what they don’t
A streaming read replica is the next step: analytics connects to a standby, and the primary only ships write-ahead log (WAL). That removes analytical CPU and I/O from the primary. It also introduces a conflict specific to long queries.
The standby has to replay WAL from the primary, and some replayed changes remove row versions that a long-running query on the standby still needs. The Postgres hot standby docs state that tables “regularly and heavily updated on the primary server will quickly cause cancellation of longer running queries on the standby.” You can raise max_standby_streaming_delay so queries finish, at the cost of the replica falling behind.
The other remedy is hot_standby_feedback, which tells the primary not to vacuum rows the standby still needs. The same docs warn that this delays cleanup on the primary and “may result in undesirable table bloat.” The replica protects the primary’s CPU, but long analytical queries can still reach back and affect its storage. A replica still uses the row-store engine. Dedicated resources can improve latency, while the underlying cost of scanning wide rows remains.
Why AI agents change the Postgres analytics question
Everything above assumes human-shaped load. Agents add dynamically generated SQL and repeated tool calls to the concurrency that dashboards already create. Query shape and total work become harder to bound when the agent chooses its next query from the previous result. This non-determinism and unpredictability make agentic workloads hard to scale.
How agents query: Bursts of mixed query shapes
Inside one task, an agent can roll up months of history, look up a single customer, filter on a high-cardinality column and join the result back to large fact tables. Onehouse’s Lakegres platform guide describes agents sending these query shapes within the same task, often at hundreds of queries a second. Postgres serves the lookups well. The rollups and wide joins are the queries the row store handles worst.
When that mix runs on an operational database, the application pays for it. The Lakegres announcement describes the result: queries serving the application see tail-latency spikes from cache thrash and resource contention, while the analytical queries still run slower than they would on an engine built for scans. A statement timeout bounds individual queries. A connection pool and admission controls must also limit concurrency and request rate.
Why agents need access controls and resource limits
Read-only privileges protect data integrity. Queries still need resource limits or separate compute to protect application latency. In July 2025, a Replit coding agent deleted a live production database during a declared code freeze, wiping records for more than 1,200 executives and over 1,190 companies. Replit’s CEO responded by rolling out automatic separation between development and production databases. That incident illustrates the risk of write access. Even correctly enforced read-only access leaves a separate problem: expensive queries can consume the CPU and memory that production traffic needs.
Read-only settings in agent tooling have failed too. In August 2025, Datadog Security Labs published a SQL injection in the since-deprecated reference Postgres MCP server: input that began with COMMIT; ended the server’s read-only transaction and ran the rest with the connection’s full privileges.
The exploit was patched in the Zed fork. Database privileges should enforce read access even if a tool’s checks fail. Those privileges still allow queries to consume CPU and memory.
Move heavy queries off Postgres without changing the interface
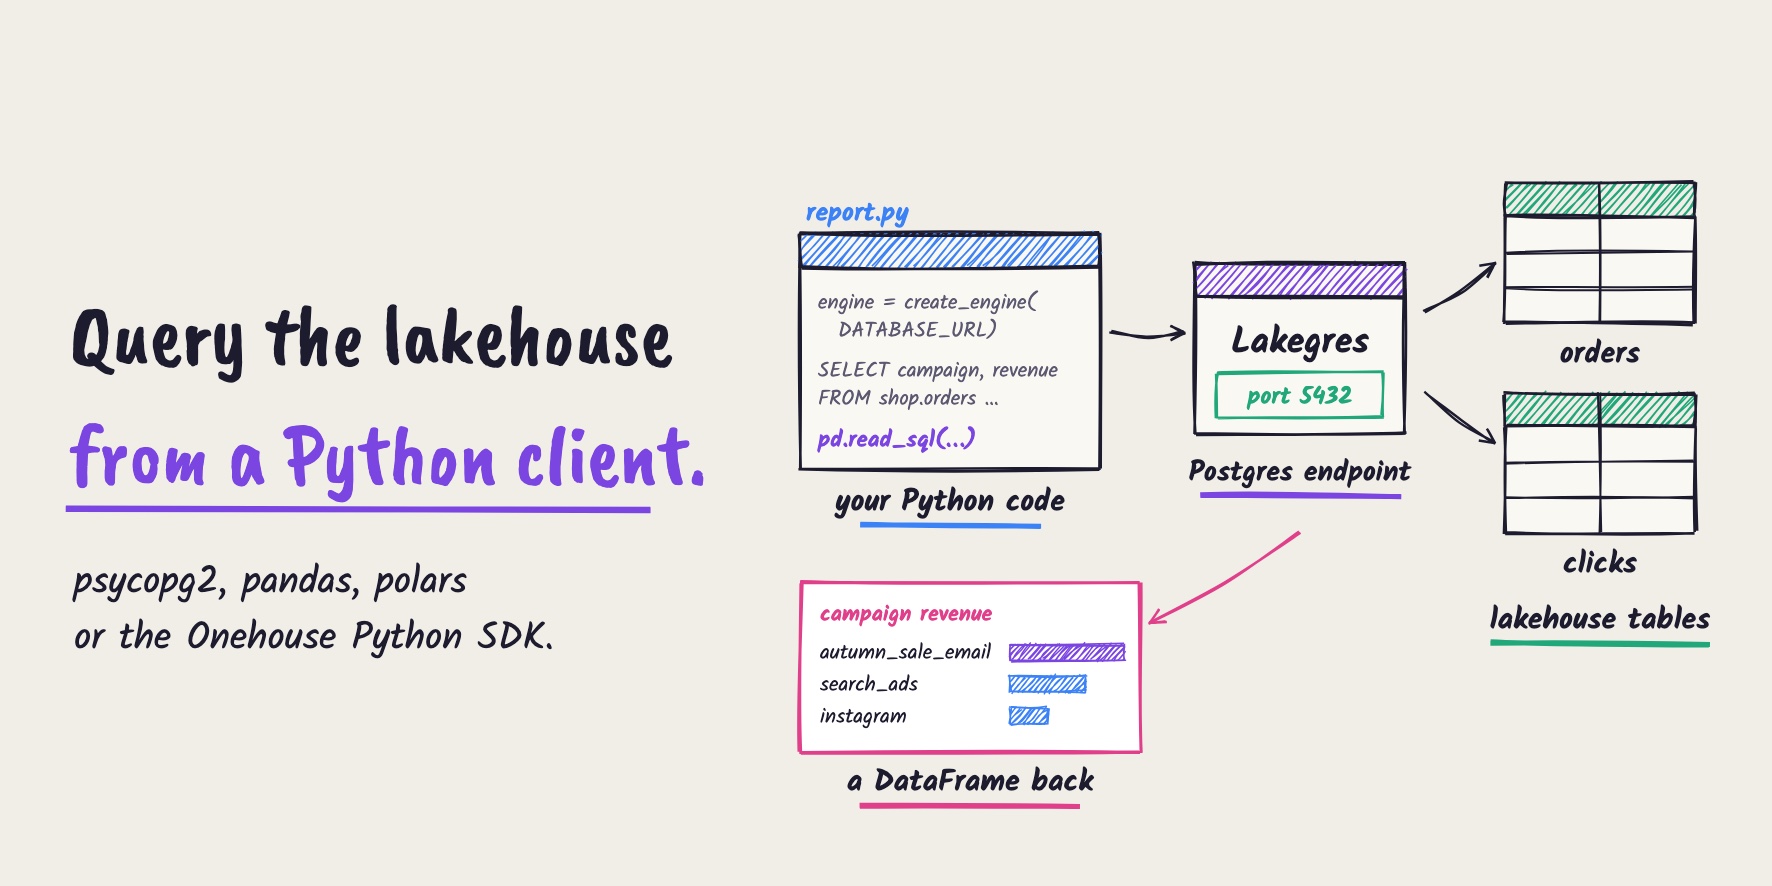
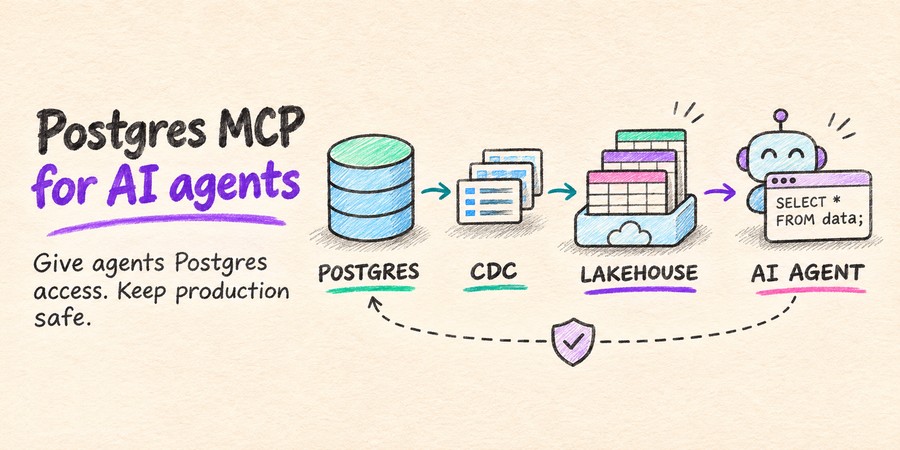
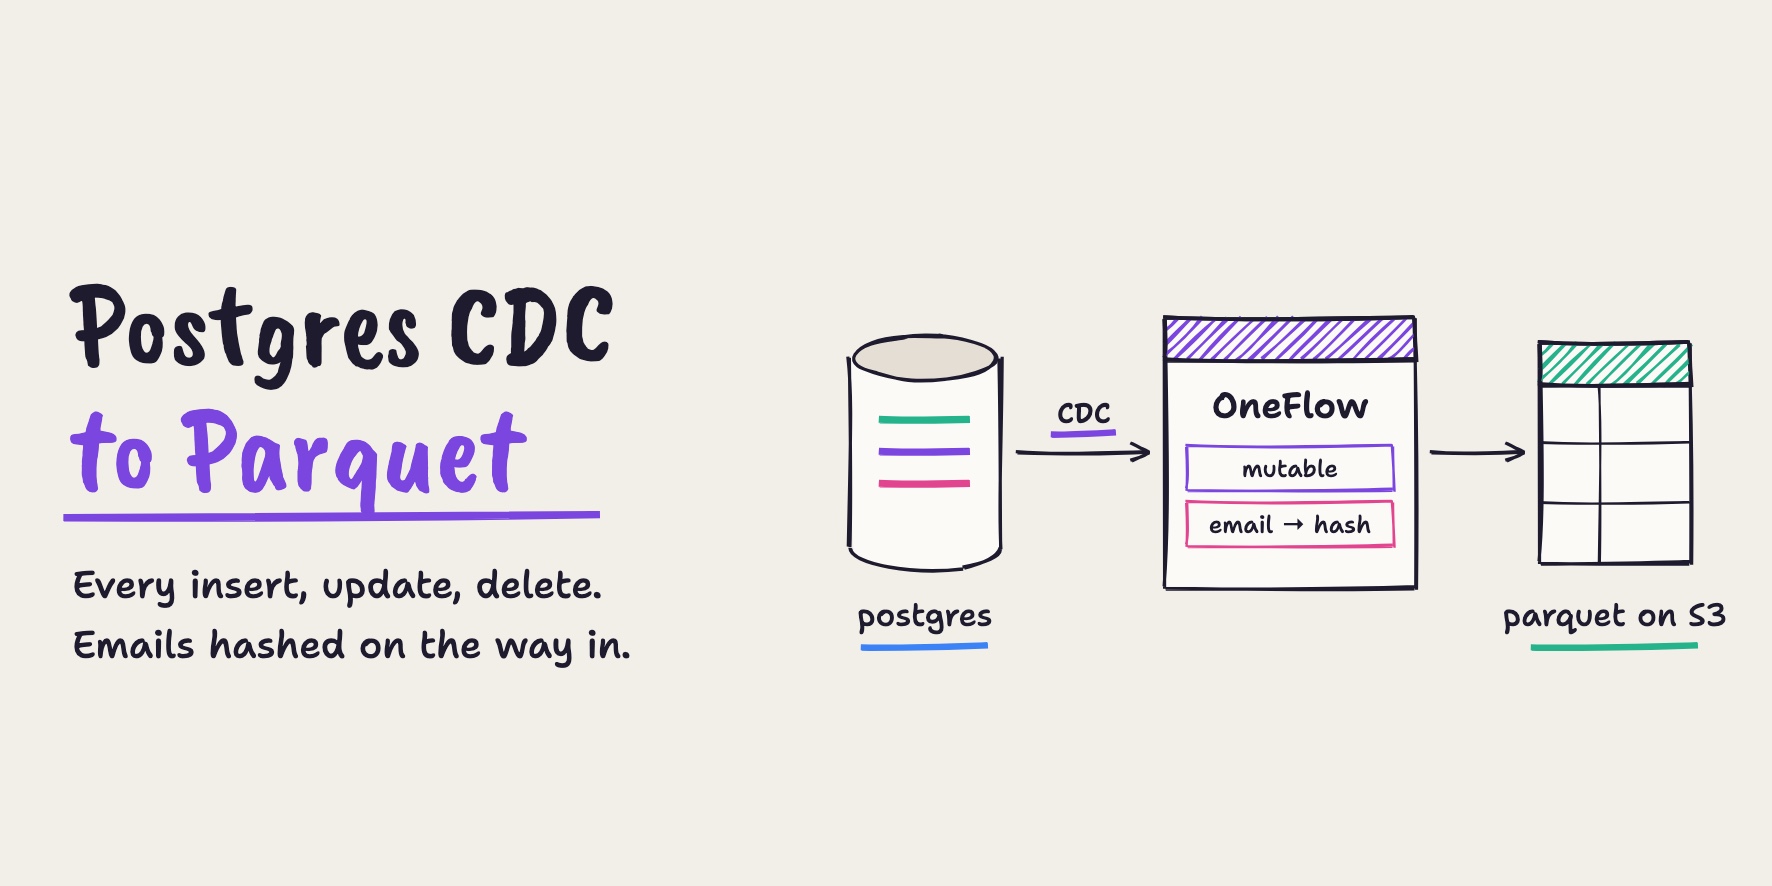
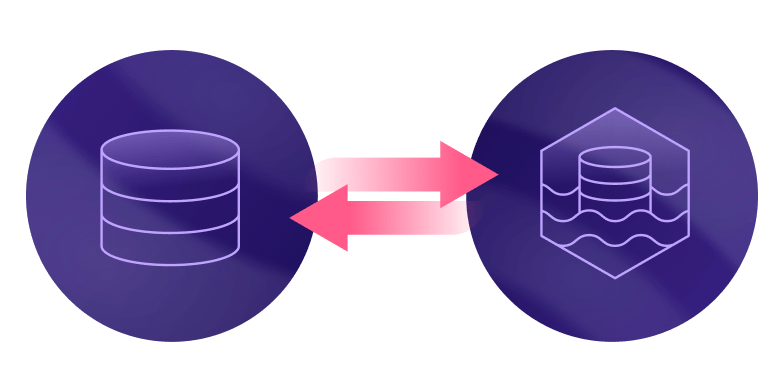
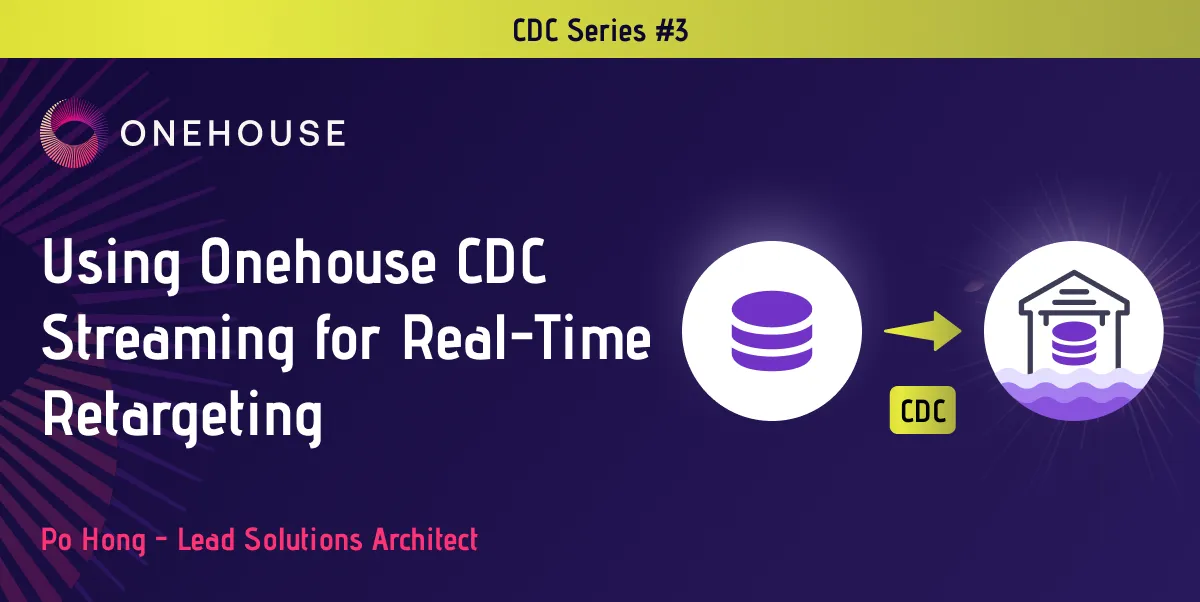
Replicate analytical data to separate compute so agents and BI tools query the copy. Change data capture (CDC) streams updates from Postgres into that copy, while the primary continues serving the application. A Postgres-compatible endpoint lets supported clients connect through the same protocol. Validate the workload’s SQL, data types and client features before switching.
The options differ in where the heavy query lands and what clients have to change.
| Option | Where the heavy query runs | What clients connect with |
|---|---|---|
| Tuning and materialized views | The production primary | Postgres |
| Extensions such as Citus or pg_duckdb | Local Postgres, Citus workers or configured remote compute | Postgres |
| Streaming read replica | A row-store standby, subject to replay conflicts | Postgres |
| Separate warehouse | The warehouse | Supported drivers and SQL dialect; compatibility varies |
| Lakehouse copy behind a Postgres endpoint | Engines reading open tables on object storage | Postgres wire protocol |
Summary of the approaches covered in this article; freshness depends on the replication method in each case.
A separate warehouse or lakehouse serving layer moves analytical work off the primary. Compare query compatibility, freshness, permissions and operating cost; a Postgres endpoint can preserve the client connection protocol. The data lands in open table formats such as Apache Hudi™ or Apache Iceberg™ on object storage, where Apache Spark™, Trino and other engines can also read it.
Lakegres: A Postgres endpoint for analytics on open lakehouse tables
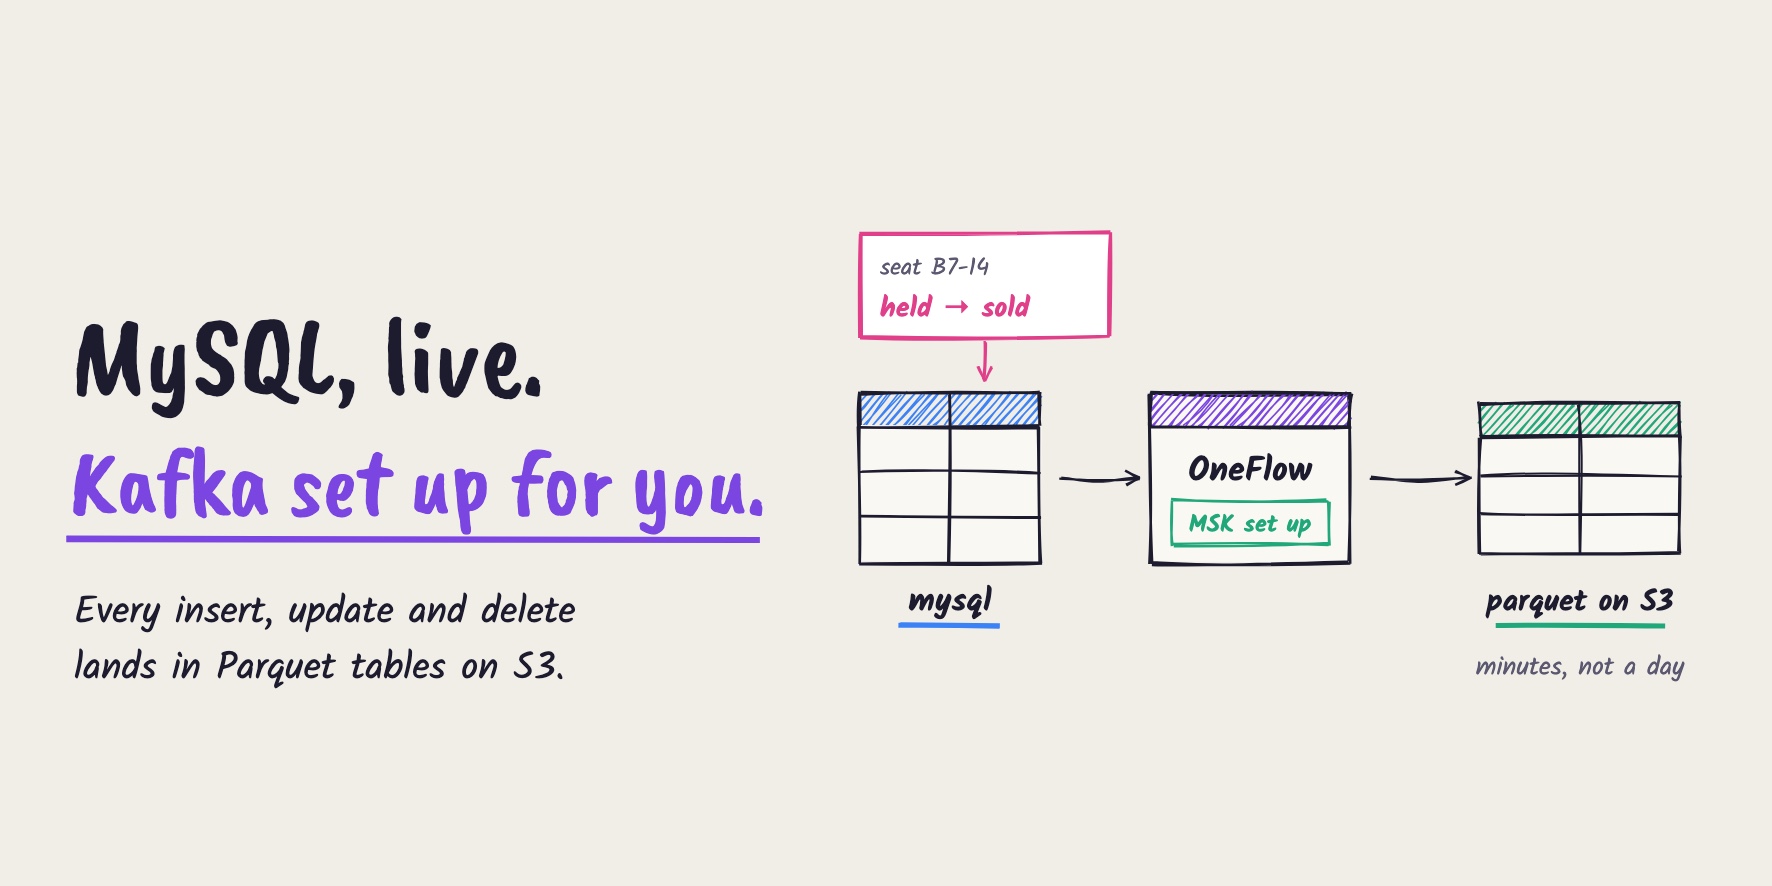
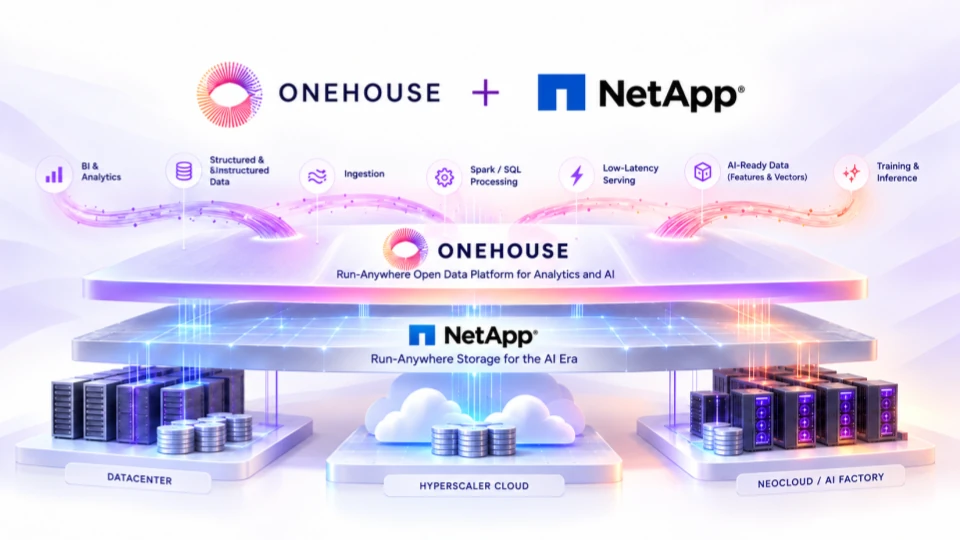
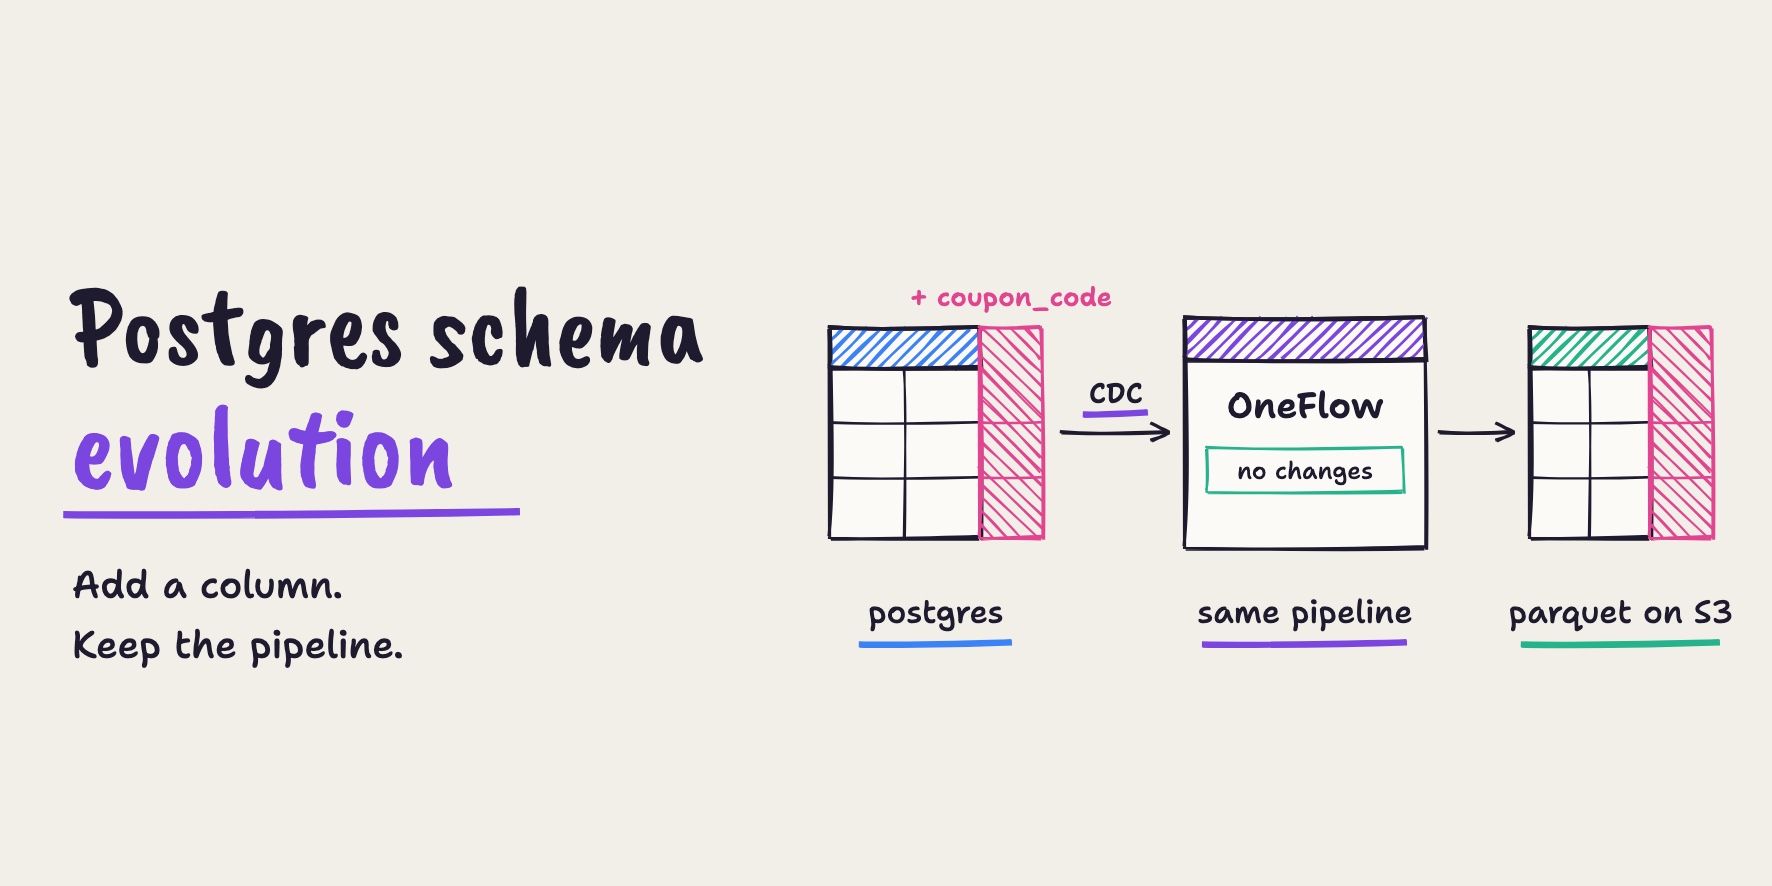
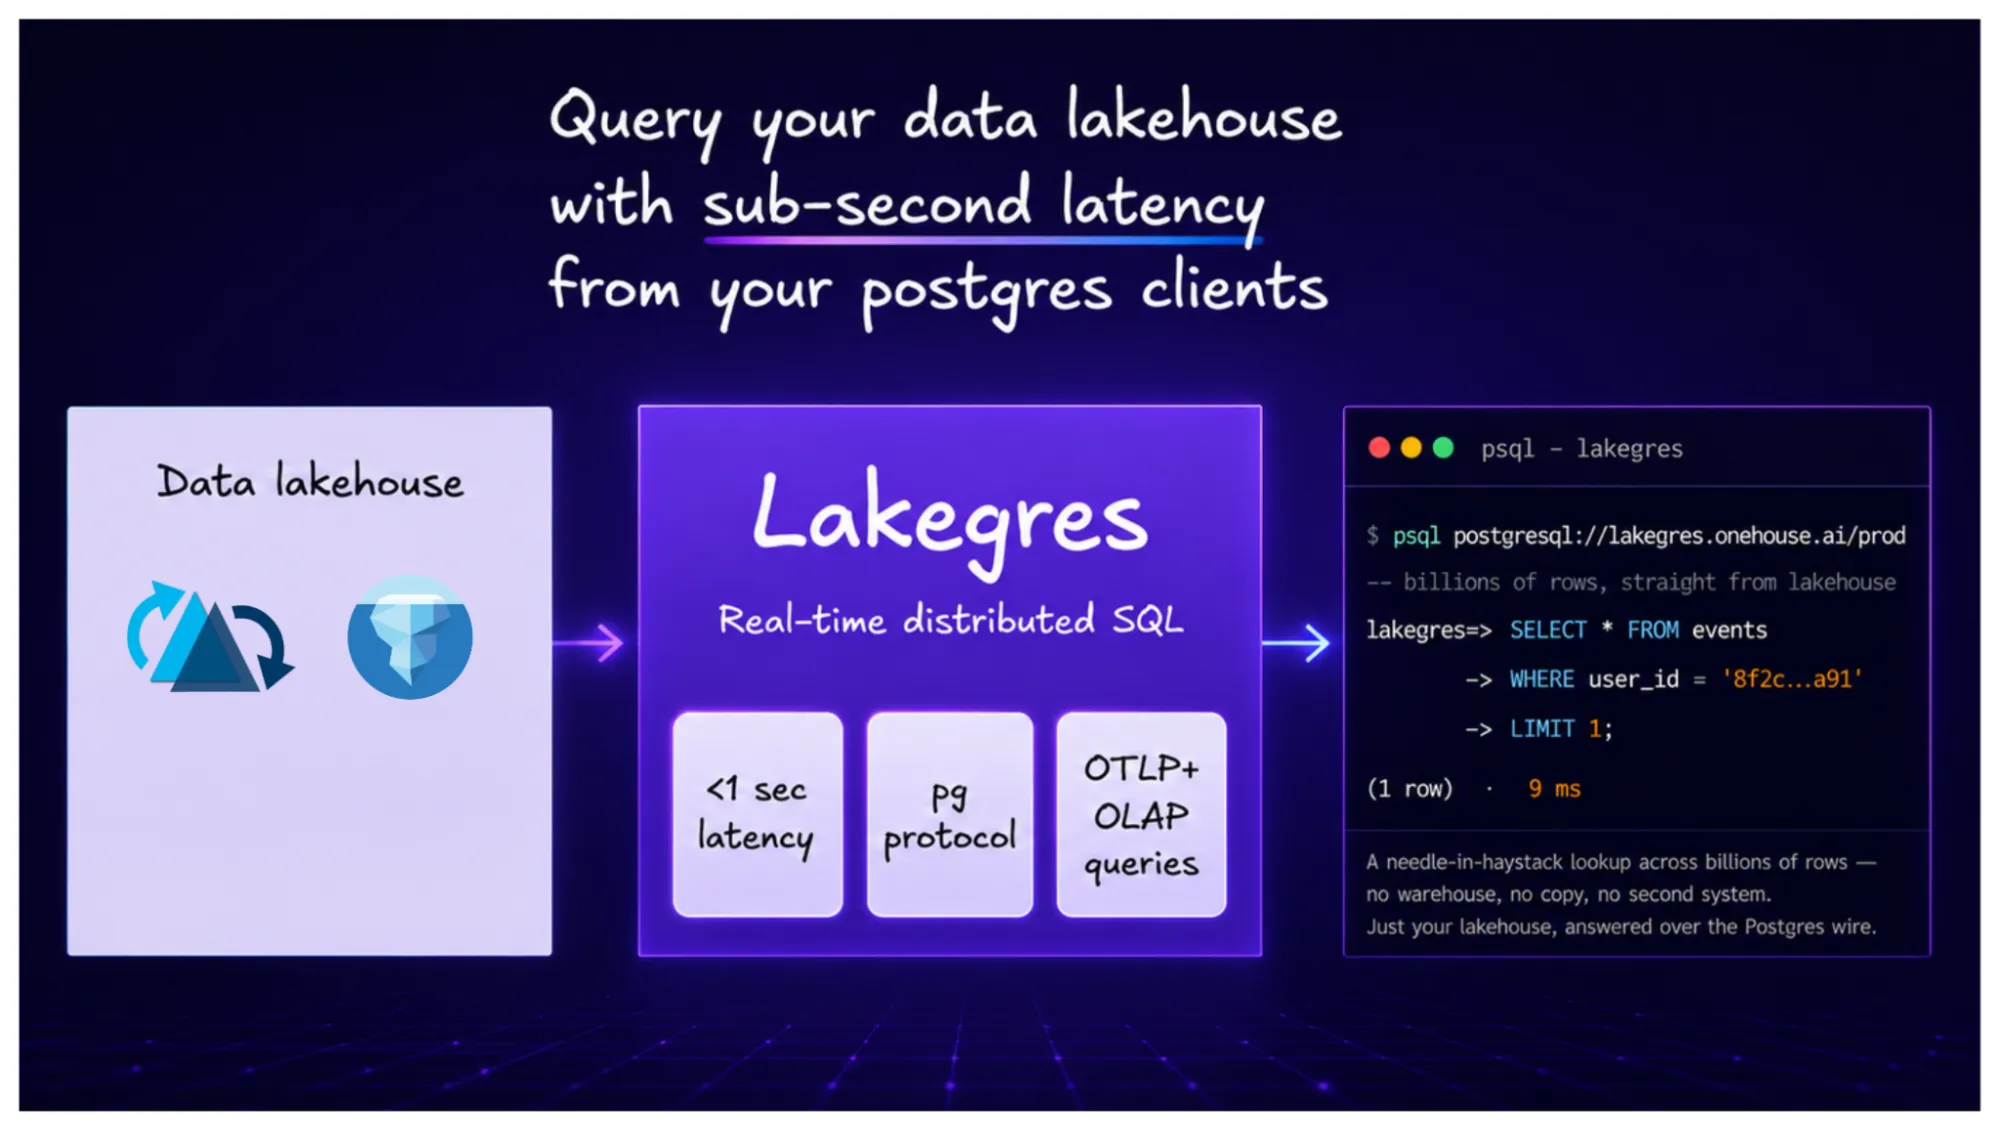
Lakegres serves analytical queries and indexed lookups directly from open lakehouse tables. Onehouse’s OneFlow ingestion service replicates PostgreSQL, MySQL, SQL Server and MongoDB into lakehouse tables and applies every update and delete, and Lakegres serves those tables through a Postgres-compatible endpoint. Postgres remains the transactional system of record; the replicated lakehouse tables are the data Lakegres queries. Those tables can be joined with data from other sources, such as application events, and queried at a past snapshot for repeatable analysis.
What runs under the Postgres endpoint
A Postgres-compatible gateway handles connections and identity, with OAuth sign-in through Okta, Microsoft Entra, Google and others. A routing layer authorizes each request and balances it across a pool of engines, and an autoscaler adds or removes engines as query load rises and falls. Access policies come from the Onehouse governance catalog, so the same table and row policies apply whether the query comes from a dashboard or an agent.
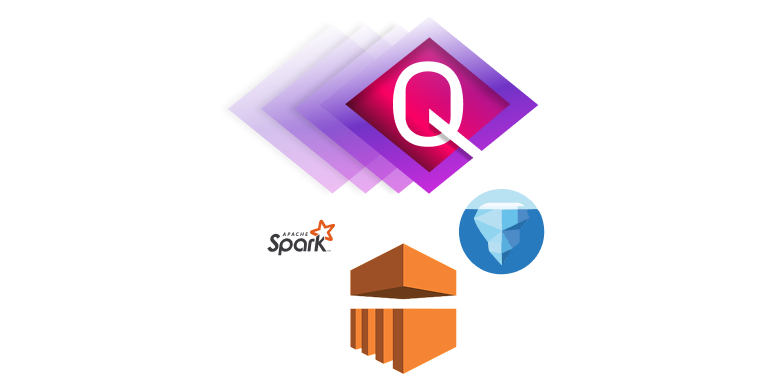
Lakegres runs queries on Quanton, Onehouse’s Spark engine. Around it, Lakegres maintains record-level and secondary indexes on Hudi and Iceberg tables, so point lookups read only matching row groups instead of scanning. Lakegres keeps cached data consistent with table commits and uses table metadata to validate cached query results. Freshness relative to Postgres still depends on replication lag.
OneFlow replicates operational data into the lakehouse so agents can run heavy, ad hoc queries on separate compute. Clients connect with psql, JDBC or ODBC, and BI tools such as Tableau, Power BI, Looker and DBeaver connect the same way.
Lakegres performance and limits
On a customer’s production tables, Onehouse measured p99 query latency of 537 ms on Lakegres against 6.0 s on AWS Athena, as reported in the Lakegres platform guide. For point lookups on the 1 TB TPC-DS web_sales table at 1:150 selectivity, the Lakegres launch post reports a 95% cut in query latency with indexes. These are Onehouse-reported results for the cited workloads.
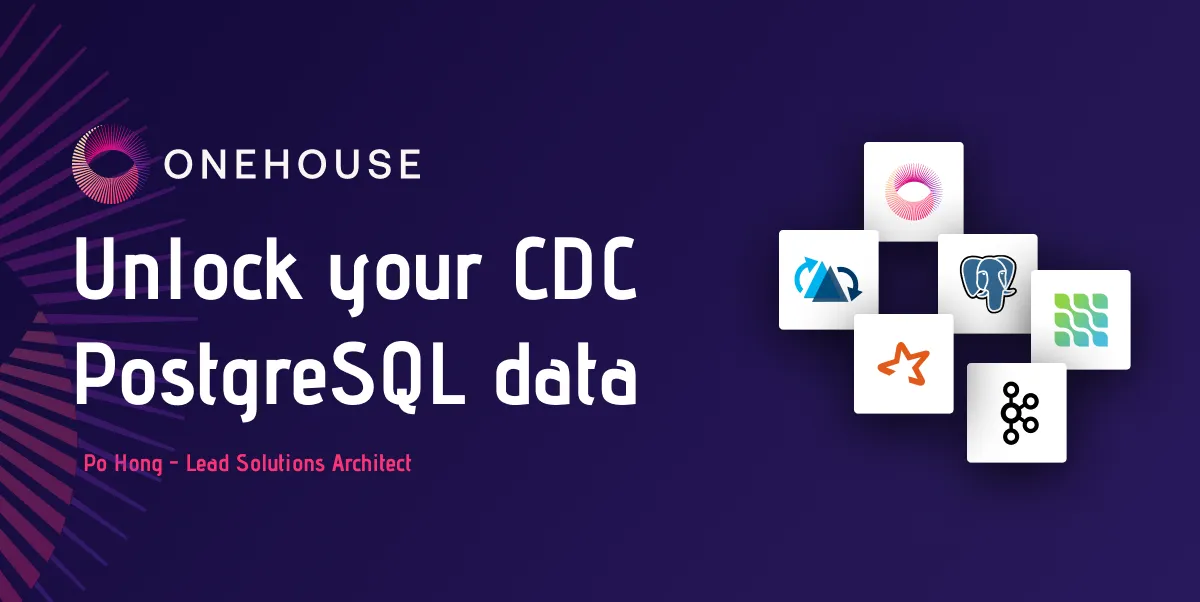
Freshness depends on pipeline configuration and observed replication lag. In Onehouse’s Postgres CDC walkthrough, the example used a five-minute sync interval, and revenue by order status matched Postgres to the cent after each change. For payment confirmation or inventory decisions, use the application’s transactional API and required consistency guarantees. A replica can also lag.
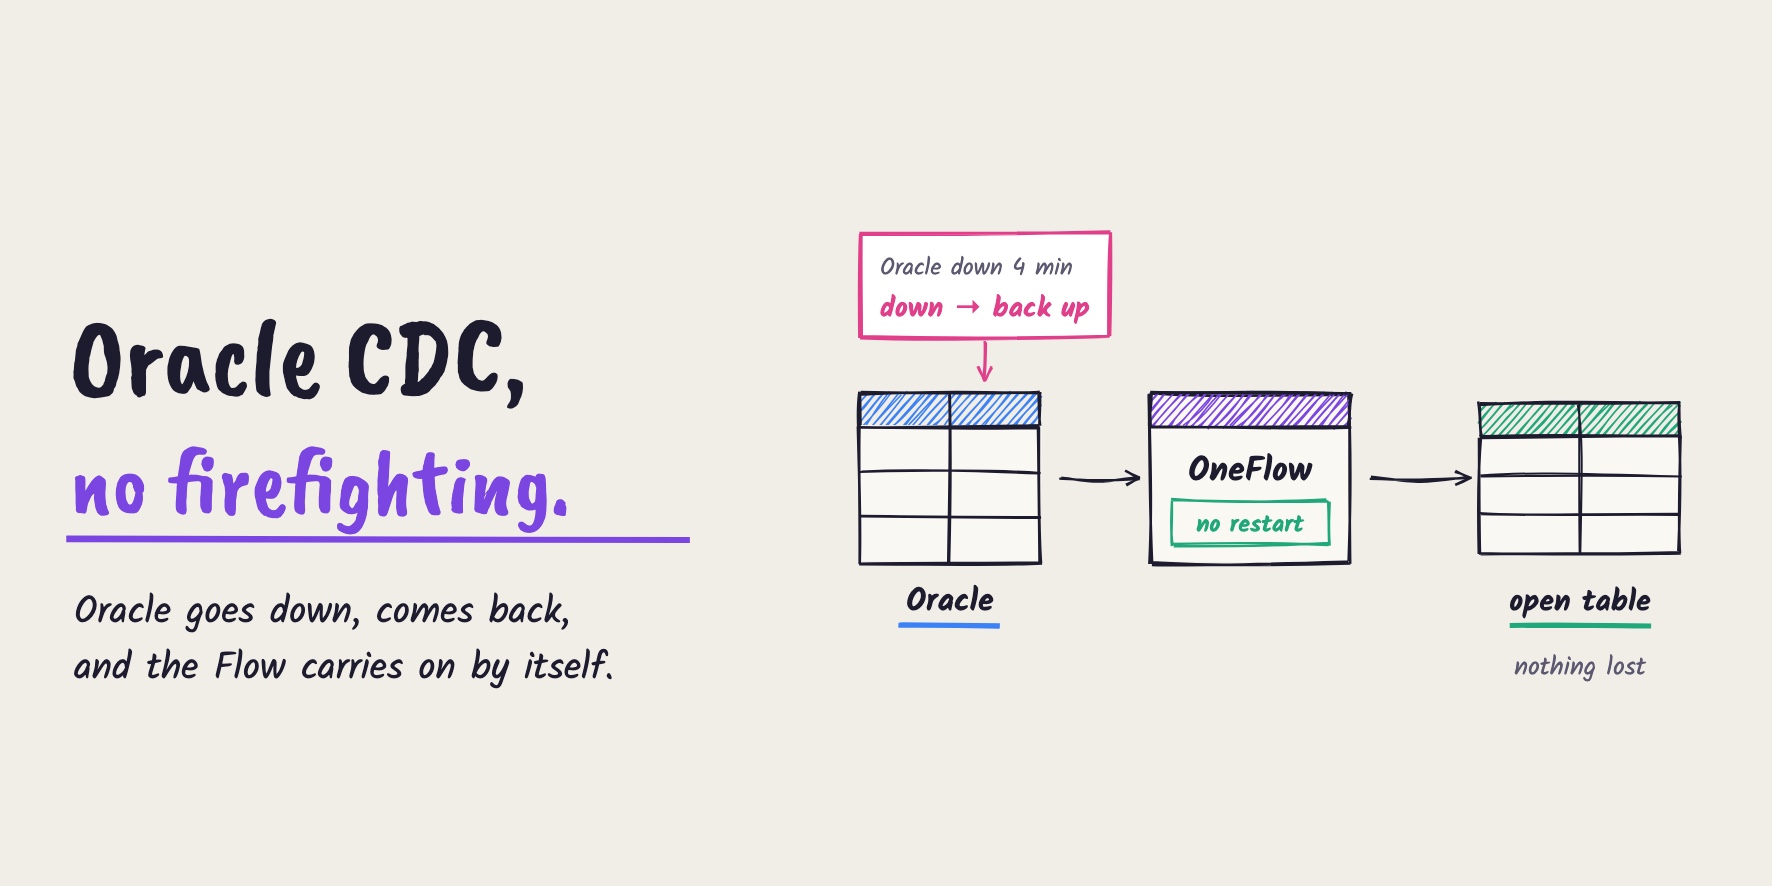
Replication runs one way, so writes still go to Postgres through the application or a scoped role. Logical replication also adds a duty on the primary: a replication slot retains WAL until its consumer reads it, so a stalled consumer grows disk usage on the source.
Lakegres text and vector search are in preview, while analytical queries and indexed lookups are in production. OneFlow and Lakegres are part of the Onehouse platform, which adds a managed service, with its own cost, to your stack.
When should you move analytics off Postgres?
Keep analytics on Postgres while queries meet their latency targets without disrupting application traffic. Tune an analytics role, pre-aggregate with materialized views, and add an extension where the workload calls for one. Move reports to a read replica once they compete with the application, and watch for query cancellations and bloat from hot_standby_feedback.
Move heavy reads to separate compute when they breach application latency targets, exhaust the query budget, or cannot meet analytical latency requirements after tuning. Test the candidate system with representative queries and concurrency, then check replication lag and SQL compatibility before switching traffic.
To try that path on your own Postgres tables, create a Onehouse account, connect a Postgres CDC source in OneFlow, and point psql at a Lakegres endpoint.
Frequently asked questions
Is Postgres an OLAP or OLTP database?
Postgres is an OLTP database. Its row-oriented heap storage and MVCC are designed for many small reads and writes with transactional guarantees. It runs analytical queries well at moderate scale, and extensions such as Citus or pg_duckdb add distributed or columnar execution, but the core engine is built for transactions.
Can I use Postgres as a data warehouse?
For small to medium analytical datasets with a limited number of users, yes, and many teams start there. Constraints appear with wide scans across very large tables and high query concurrency, where columnar storage and separate compute help. Keeping the warehouse workload on a separate instance from the application database avoids the contention described above.
Is Postgres good for time-series analytics?
Yes, with the right setup. Native declarative partitioning by time keeps scans to the relevant ranges, and BRIN indexes stay small on append-only, time-ordered tables. TimescaleDB adds hypertables that partition automatically and continuous aggregates that keep rollups current.
How do I let AI agents query Postgres data safely?
Use narrowly scoped application APIs for operations that require current transactional state. For SQL reads, enforce database privileges, timeouts and concurrency limits; route broad analytical queries to a replicated copy and monitor its lag. Keep credentials out of the model’s context. Lakegres serves that copy over the Postgres wire protocol, and agents that connect through the Onehouse AI Gateway reach it through the gateway’s built-in MCP server, under the same catalog policies.
Author
Bhavani Sudha Saktheeswaran
Head of Open Source
Sudha is the Head of Open Source at Onehouse and a PMC member of the Apache Hudi project. She comes with vast experience in real-time and distributed data systems through her work at Moverworks, Uber and Linkedin’s data infra teams. She is a key contributor to the early Presto integrations of Hudi. She is passionate about engaging with and driving the Hudi community.