Talk with our engineers by joining the new Onehouse community Slack!
TL;DR
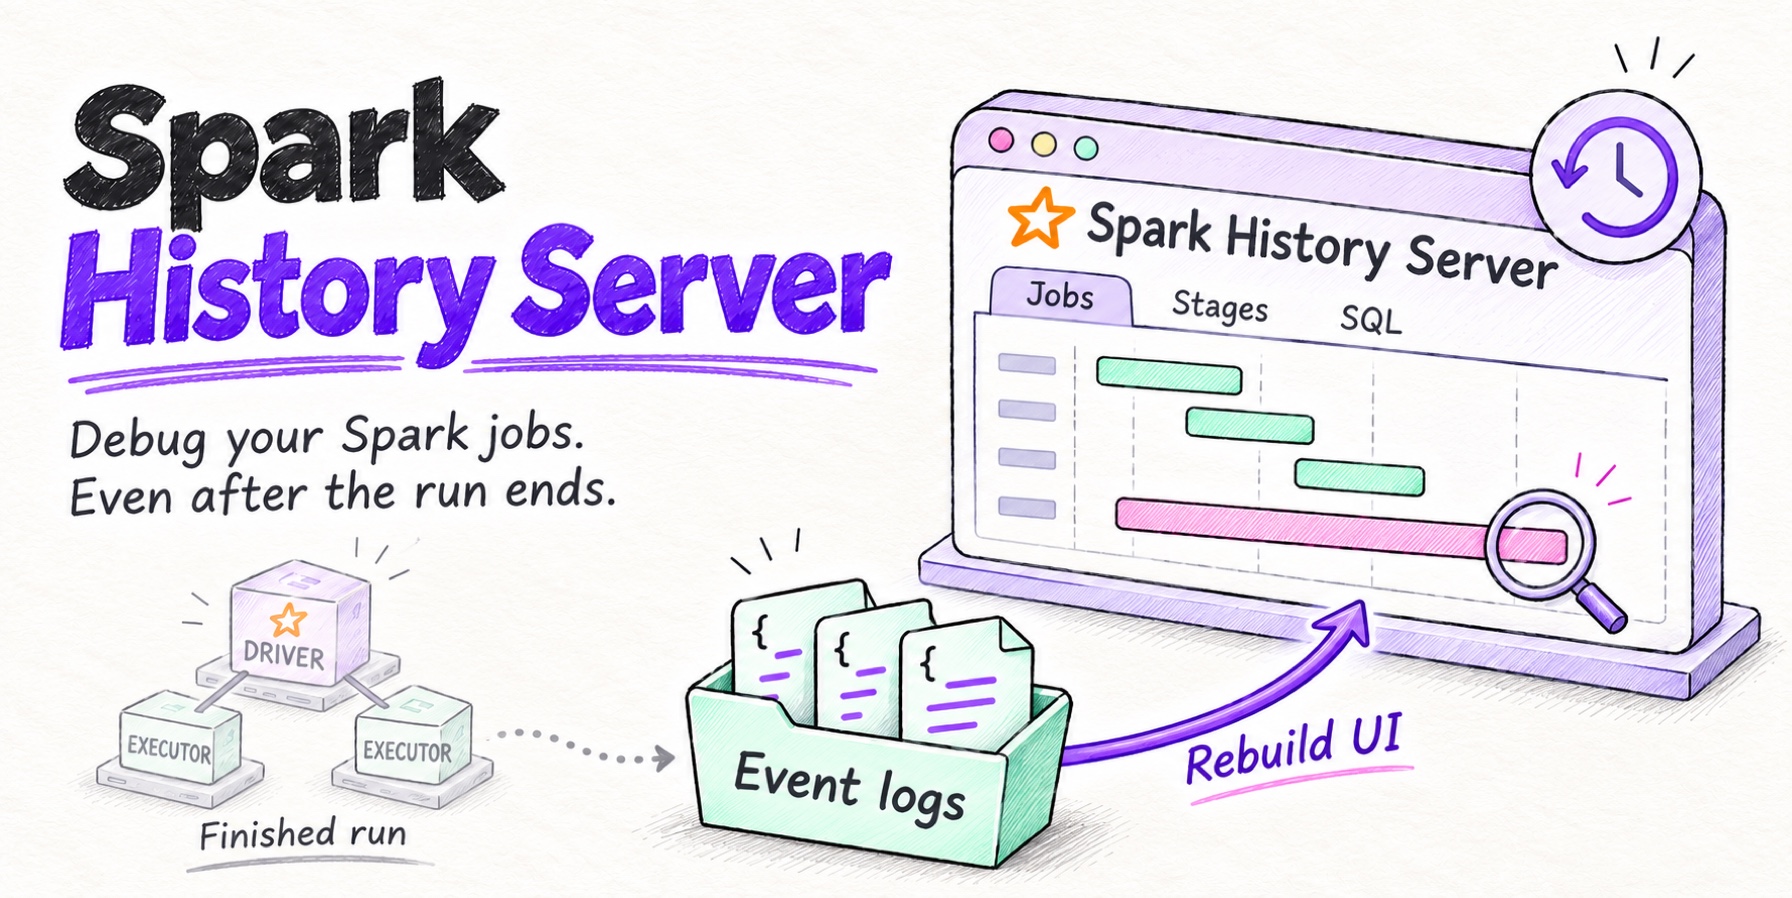
The Spark History Server rebuilds the Spark UI from the event logs a job writes while it runs, so you can inspect a run after its driver and cluster are gone. Set spark.eventLog.enabled to true, point spark.eventLog.dir and spark.history.fs.logDirectory at the same durable path such as S3, and start the server on port 18080. Then debug by symptom: failed tasks and their errors on the stage page, skew and spill in the stage summary metrics, GC time in the Executors tab, the physical plan in the SQL tab, and the exact configuration in the Environment tab. The REST API under /api/v1 lets you script comparisons between runs.
The Spark History Server is a web server that rebuilds the Spark UI for applications that have already finished. While a job runs, its driver serves the live Spark UI on port 4040, and that UI disappears when the driver exits, which on a job cluster usually means the moment the job ends or fails. If the job wrote event logs, the History Server replays them and gives you the same Jobs, Stages, SQL, Executors and Environment pages for the finished run, plus a REST API.
This guide sets one up, then uses it to debug a run that failed, a run that was slow, and a run that changed from one day to the next. Every screen and output below comes from Apache Spark™ 4.3.0 on a two-executor local cluster, with event logs in a local directory read by a History Server on port 18080. On a real platform, you point both at object storage instead.
What the Spark History Server is
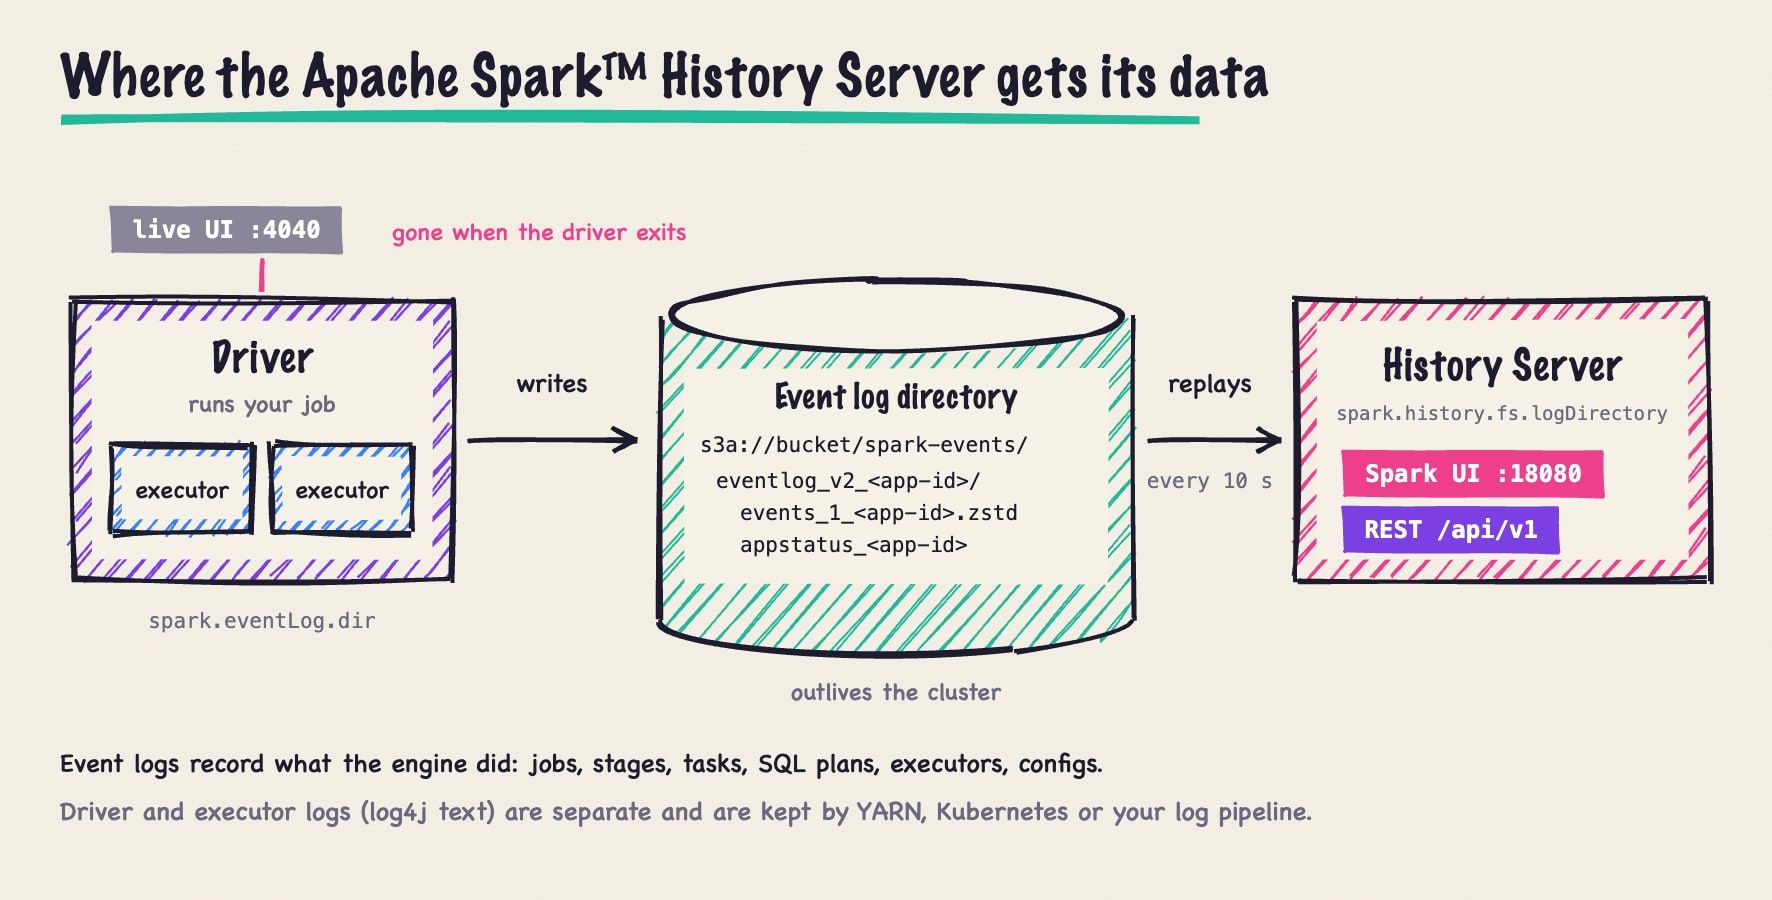
With event logging on, the driver records every scheduler and SQL event as a line of JSON: jobs and stages starting and ending, each task’s metrics, executors joining and leaving, every SQL plan and the full configuration. The History Server watches its log directory, lists the applications it finds, and replays a log through the same listeners the live UI uses when you open it. That’s why the pages look identical. It’s also why the History Server can only show what was logged: anything the driver never wrote down left with the driver.
Event logs vs. driver and executor logs
A post-mortem usually needs two kinds of logs, and the History Server only reads one of them.
| Event logs | Driver and executor logs | |
|---|---|---|
| Format | Structured JSON events from Spark’s listener bus | Free-text log4j output from Spark and your code |
| Written by | The driver | The driver and every executor |
| Read with | The History Server and its REST API | YARN, kubectl logs, your log pipeline |
| Answers | Which stage failed, how long tasks took, what they shuffled and spilled, which plan and configuration ran | Full stack traces, your own log lines, why a container was killed |
The History Server shows each failed task’s error with a +details link to the stack trace, which is often enough. When an executor was killed by YARN or Kubernetes, though, the event log only records that the executor was removed. The reason is in the cluster manager’s logs.
Setting up the Spark History Server
Three settings, in spark-defaults.conf or passed with --conf, make it work:
spark.eventLog.enabled           true
spark.eventLog.dir               s3a://my-bucket/spark-events
spark.history.fs.logDirectory    s3a://my-bucket/spark-events
Event logging is off by default, and spark.eventLog.dir defaults to file:///tmp/spark-events on the driver’s machine, which goes away with the machine. Point jobs and the server at the same durable path: S3, Google Cloud Storage, Azure Data Lake Storage or HDFS. On HDFS or a local path, create the directory first, because Spark won’t.
Then start the server:
$SPARK_HOME/sbin/start-history-server.shIt runs in the background, logs to $SPARK_HOME/logs, serves the UI on port 18080 (spark.history.ui.port) and checks the directory for new or updated logs every 10 seconds (spark.history.fs.update.interval). Server-side settings go in spark-defaults.conf or SPARK_HISTORY_OPTS, and SPARK_DAEMON_MEMORY sets its heap, 1 GB by default, as described in the monitoring docs.
Since Spark 4.0, event logs are compressed and rolled by default, so each application gets its own directory. These are the four applications used in this guide:
$ ls spark-events/*
spark-events/eventlog_v2_app-20261107222920-0000:
appstatus_app-20261107222920-0000
events_1_app-20261107222920-0000.zstd

spark-events/eventlog_v2_app-20261107222926-0000:
appstatus_app-20261107222926-0000
events_1_app-20261107222926-0000.zstd

spark-events/eventlog_v2_app-20261107222941-0000:
appstatus_app-20261107222941-0000
events_1_app-20261107222941-0000.zstd

spark-events/eventlog_v2_app-20261107223007-0000:
appstatus_app-20261107223007-0000.inprogress
events_1_app-20261107223007-0000.zstd
The appstatus file keeps its .inprogress suffix until the application stops cleanly. That’s how the server tells a finished run from one that is still running or that crashed.
Configs for production
# On by default since Spark 4.0; set them explicitly on Spark 3.x
spark.eventLog.compress               true
spark.eventLog.compression.codec      zstd
spark.eventLog.rolling.enabled        true
spark.eventLog.rolling.maxFileSize    128m

# History Server: delete old logs and keep its UI store on disk
spark.history.fs.cleaner.enabled      true
spark.history.fs.cleaner.maxAge       30d
spark.history.store.path /var/lib/spark-history- Compression shrinks every log you keep, and zstd is the default codec.
- Rolling splits a long-running or streaming application’s log into 128 MB files. Setting
spark.history.fs.eventLog.rolling.maxFilesToRetainalso turns on compaction, which drops events for finished jobs. The docs call it lossy, so reserve it for streaming applications. - The cleaner is off by default, so logs pile up forever. With it on, the server deletes logs older than
maxAge(7 days by default) once a day, which means it needs delete permission on the bucket. spark.history.store.pathkeeps parsed UI data on local disk, so the server needs less heap and doesn’t reparse every log after a restart.- Redaction: values whose keys match
spark.redaction.regex, by default(?i)secret|password|token|access[.]?key|credential, are masked in event logs and the Environment page. Extend it to cover your own secret names.
Running it on Kubernetes
Spark on Kubernetes keeps nothing for you. The driver UI is reachable through kubectl port-forward only while the driver pod is running, and an event log written to the pod’s disk disappears with the pod. Jobs need spark.eventLog.dir on object storage, and the History Server runs as its own Deployment reading the same path.
The apache/spark images don’t include the S3 connector. Spark 4.3.0 is built on Hadoop 3.5.0, so add the matching hadoop-aws jar and the AWS SDK bundle Hadoop 3.5.0 was built against (2.35.4) to the job image and the History Server image. The Hadoop docs require hadoop-aws to match the Hadoop version exactly.
FROM apache/spark:4.3.0
ARG MVN=https://repo1.maven.org/maven2
USER root
ADD ${MVN}/org/apache/hadoop/hadoop-aws/3.5.0/hadoop-aws-3.5.0.jar \
    ${MVN}/software/amazon/awssdk/bundle/2.35.4/bundle-2.35.4.jar \
    /opt/spark/jars/
RUN chmod 644 /opt/spark/jars/*.jar
USER spark
SPARK_NO_DAEMONIZE keeps the server in the foreground so the container stays up, and SPARK_HISTORY_OPTS carries its settings:
apiVersion: apps/v1
kind: Deployment
metadata:
  name: spark-history-server
spec:
  replicas: 1
  selector:
    matchLabels:
      app: spark-history-server
  template:
    metadata:
      labels:
        app: spark-history-server
    spec:
      serviceAccountName: spark-history-server
      containers:
      - name: history-server
        image: registry.example.com/spark-s3:4.3.0
        command: ["/opt/spark/sbin/start-history-server.sh"]
        env:
        - name: SPARK_NO_DAEMONIZE
          value: "true"
        - name: SPARK_HISTORY_OPTS
          value: >-
            -Dspark.history.fs.logDirectory=s3a://my-bucket/spark-events
            -Dspark.history.fs.cleaner.enabled=true
        ports:
        - containerPort: 18080
---
apiVersion: v1
kind: Service
metadata:
  name: spark-history-server
spec:
  selector:
    app: spark-history-server
  ports:
  - port: 18080
The service account needs read access to the bucket, and delete access if the cleaner is on. With IAM roles for service accounts on EKS, also set spark.hadoop.fs.s3a.aws.credentials.provider to software.amazon.awssdk.auth.credentials.WebIdentityTokenFileCredentialsProvider, which isn’t in S3A’s default provider chain. We ran the same start command and environment variables locally and the server came up in the foreground with all four applications. If you’d rather not maintain a manifest, the Apache Spark Kubernetes Operator ships a History Server example and Stackable has a SparkHistoryServer resource. The community Helm chart on Artifact Hub still pins Spark 3.3.
Managed platforms
Most platforms run a History Server for you. What changes is where the logs live and how long they’re kept.
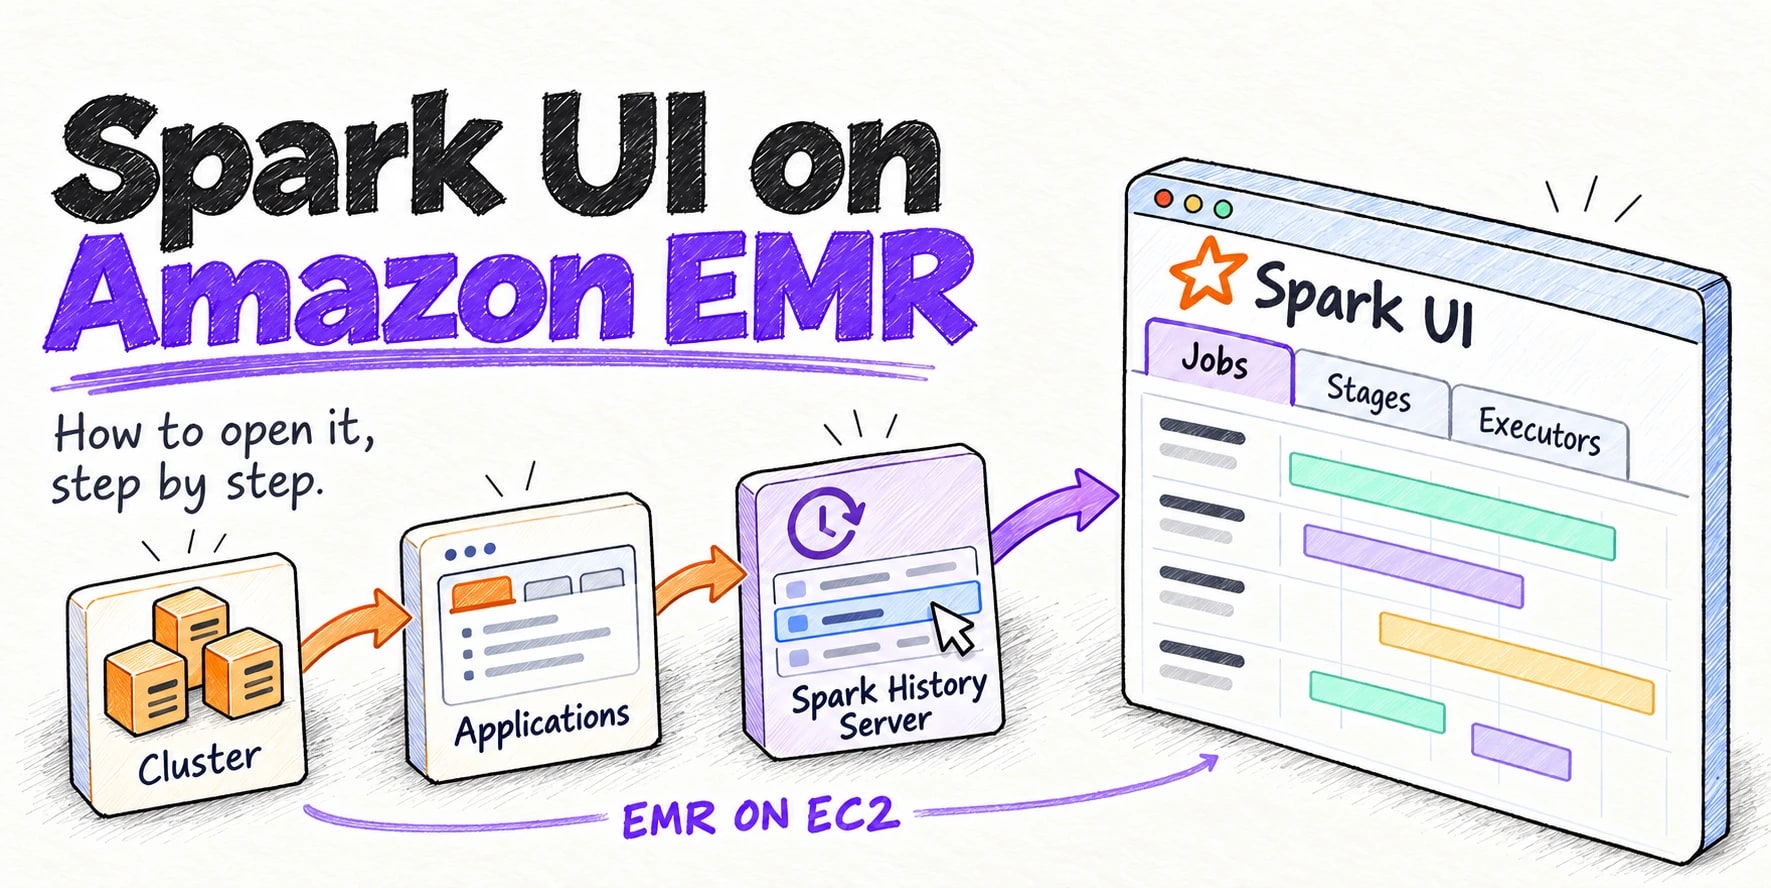
- Amazon EMR on EC2 hosts persistent application UIs off-cluster from release 5.25.0. They stay available for 30 days after the application ends, as long as event logs are in the default HDFS location. See our guide to the Spark UI on Amazon EMR.
- Google Cloud Dataproc, now part of Managed Service for Apache Spark, drops job-cluster UIs when the cluster is deleted. You create a single-node Persistent History Server cluster with
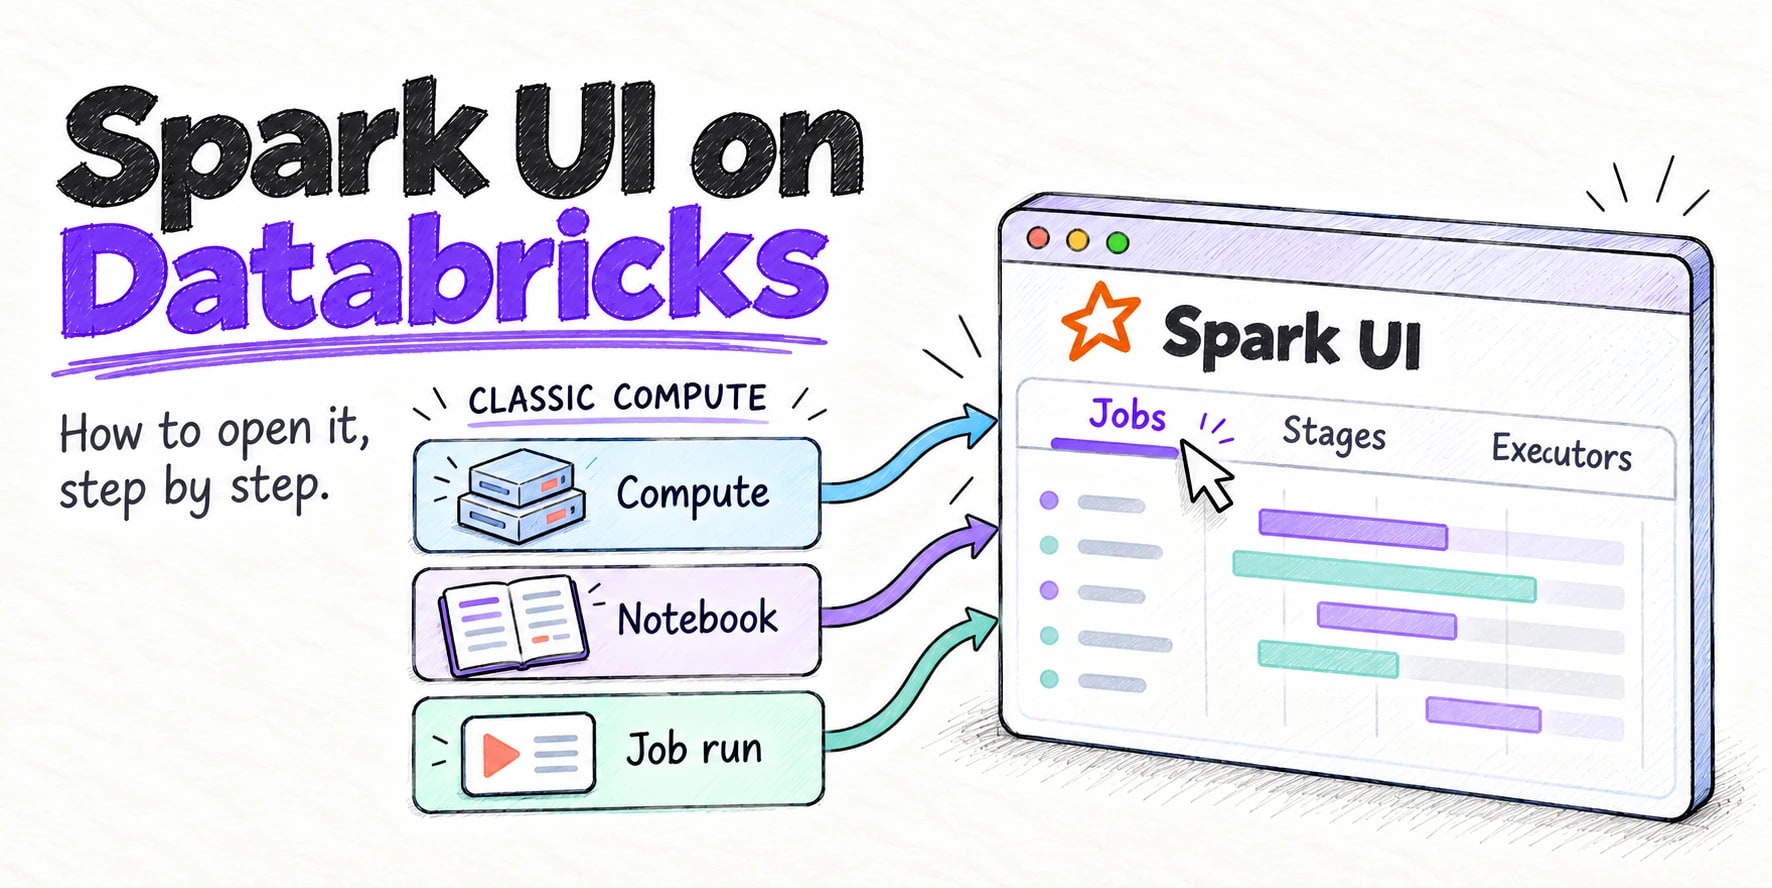
spark:spark.history.fs.logDirectoryon a Cloud Storage bucket and point job clusters’spark:spark.eventLog.dirat the same bucket. Serverless batches attach to it with--history-server-cluster. - Databricks keeps a terminated cluster’s Spark UI until the compute is deleted, 30 days after termination unless it’s pinned, and restarting the cluster replaces it. Compute log delivery copies driver, worker and event logs to a volume or S3 every five minutes. Serverless compute has no Spark UI. See our guide to the Spark UI on Databricks.
- AWS Glue writes event logs when a job sets
--enable-spark-ui trueand--spark-event-logs-path s3://.... Glue 3.0 and later jobs open the Spark UI from the console, or you can run your own History Server from AWS’s CloudFormation template or Docker image.
Debugging a failed job
Our orders-ingest job reads CSV files and casts the amount column to a decimal. The Jobs page shows job 1 failed, and the Stages page lists stage 1 under Failed Stages with the reason CAST_INVALID_INPUT. Open the stage, then type FAILED in the task table’s search box:
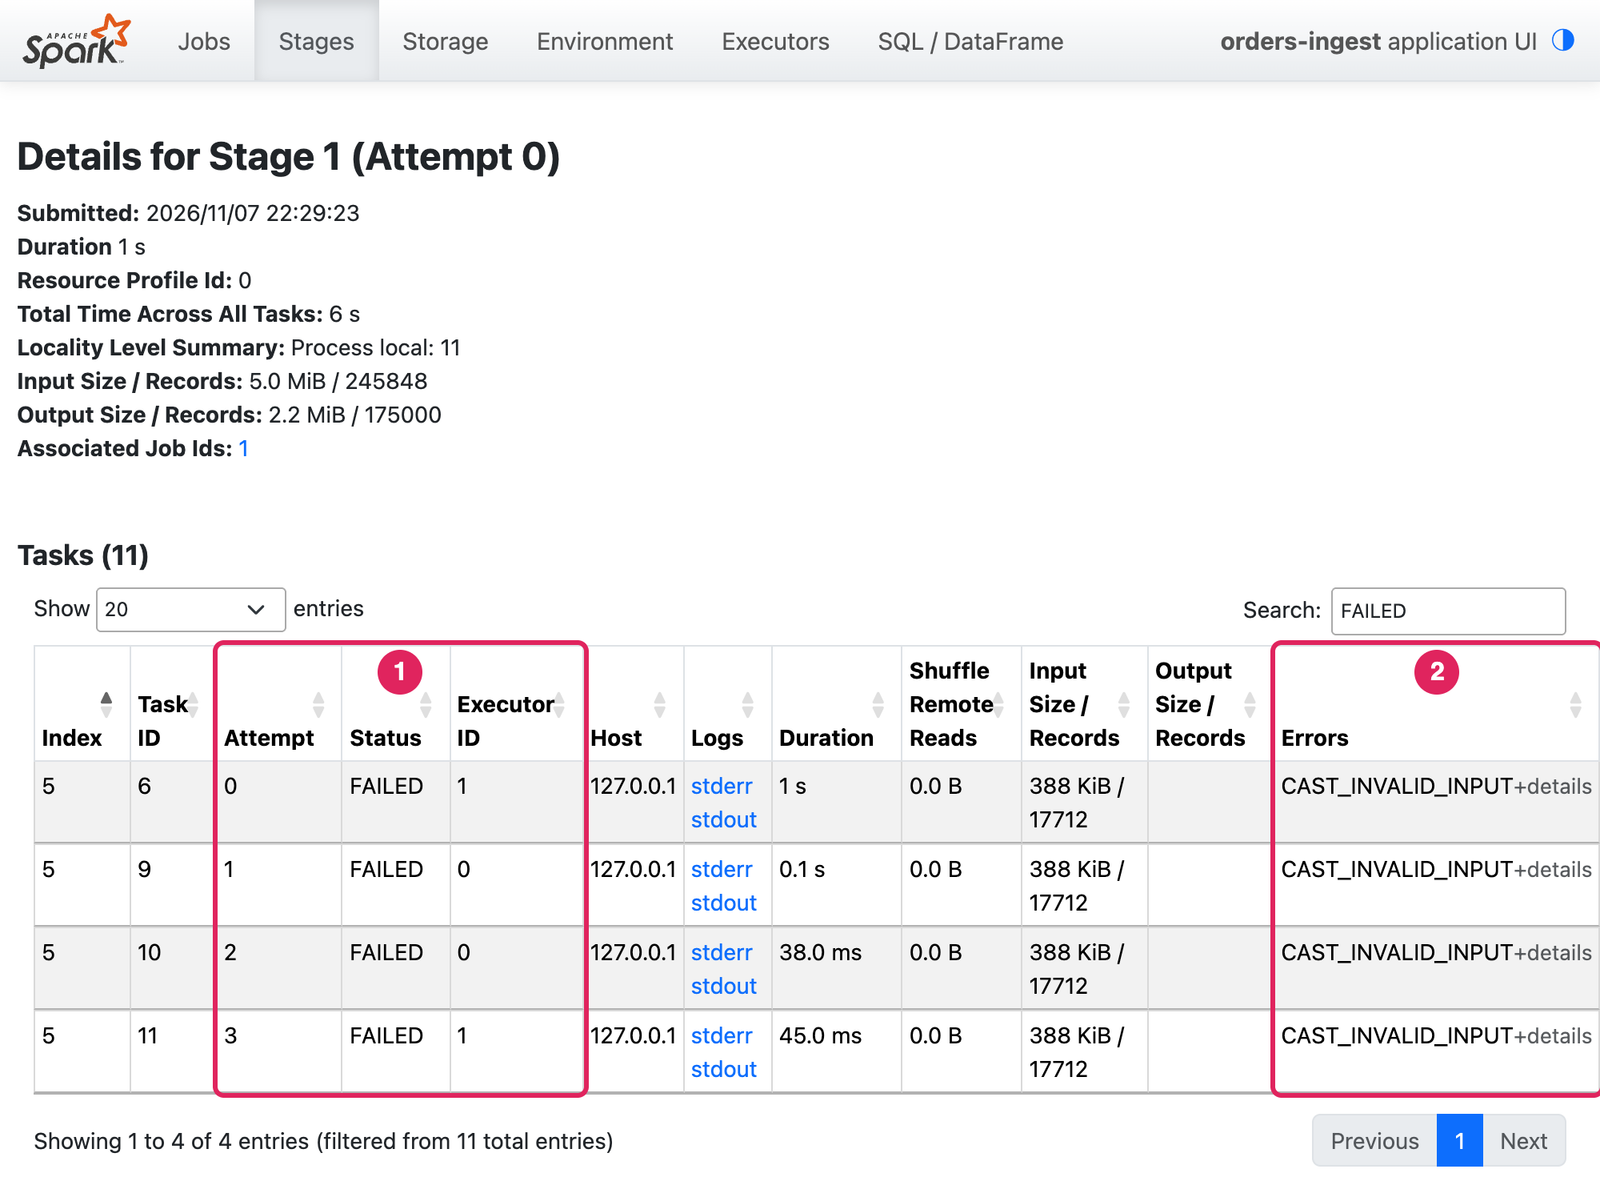
Task 5 failed four times, which is the default for spark.task.maxFailures, and then Spark aborted the job. The retries ran on executor 1, then 0, 0 and 1, and every attempt hit the same error. +details shows the message:
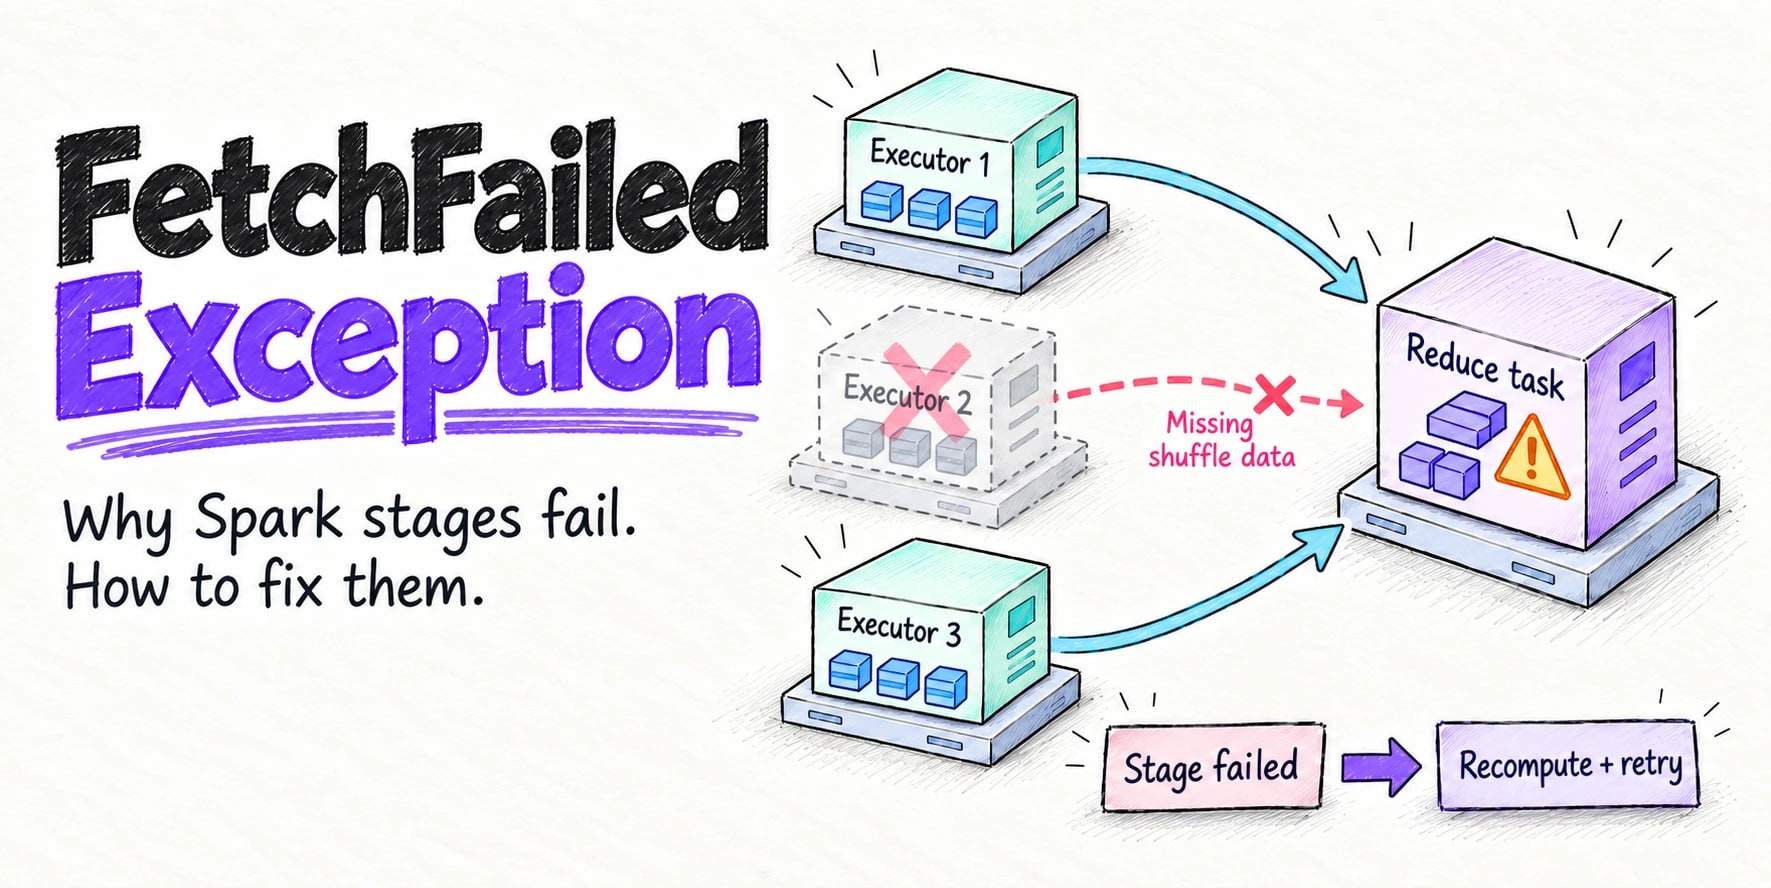
[CAST_INVALID_INPUT] The value 'N/A' of the type "STRING" cannot be cast to "DECIMAL(10,2)" because it is malformed. Correct the value as per the syntax, or change its target type. Use `try_cast` to tolerate malformed input and return NULL instead. SQLSTATE: 22018The same error on different executors means a data or code problem that retrying can’t fix. This one is common after an upgrade to Spark 4, which turned on ANSI mode by default, so a bad cast fails the task instead of returning null. Clean the input or use try_cast. Errors that differ by executor point at the machine instead: ExecutorLostFailure or a FetchFailedException means an executor died, and the Executors page (or /allexecutors in the REST API) lists dead executors with the reason they were removed. Before changing code, check the Environment page for the configuration the failed run actually used.
Debugging a slow job
Our daily-revenue job runs two steps: revenue by country, then a running total of spend per customer, computed with a window over customer_id. One customer, a marketplace account, owns 30% of the orders. Open the stage that took longest and read Summary Metrics across, from median to max:
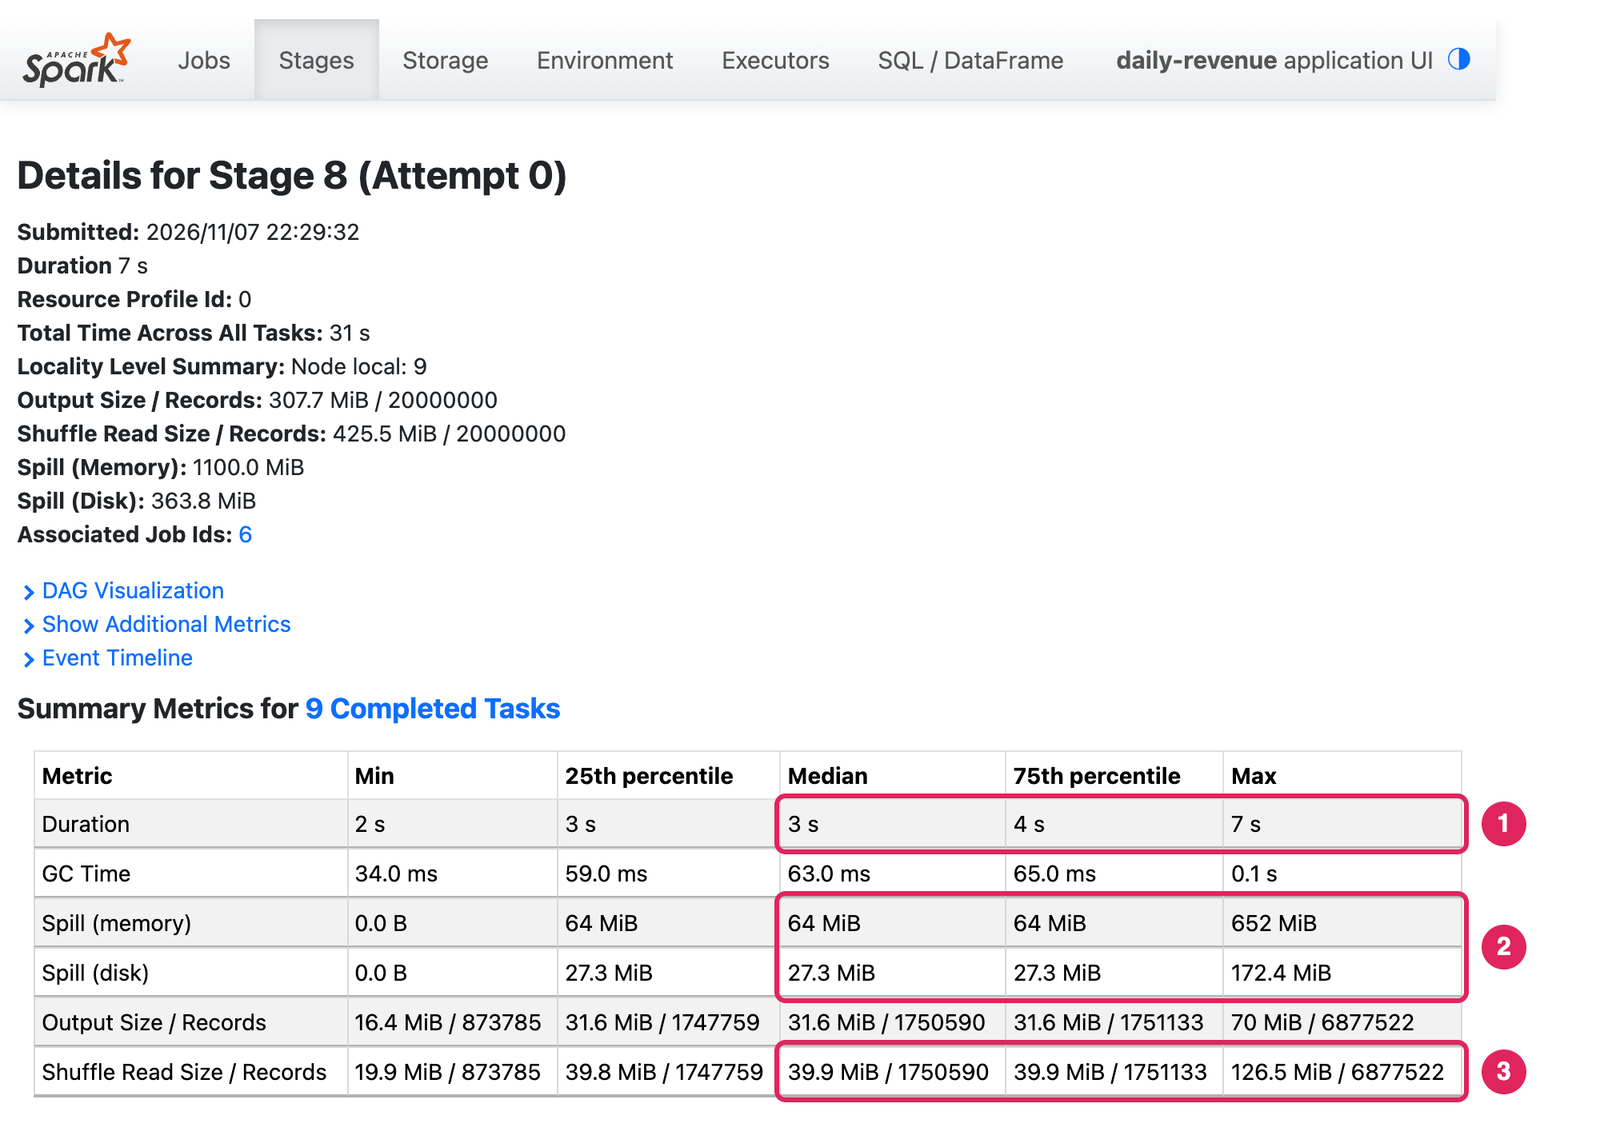
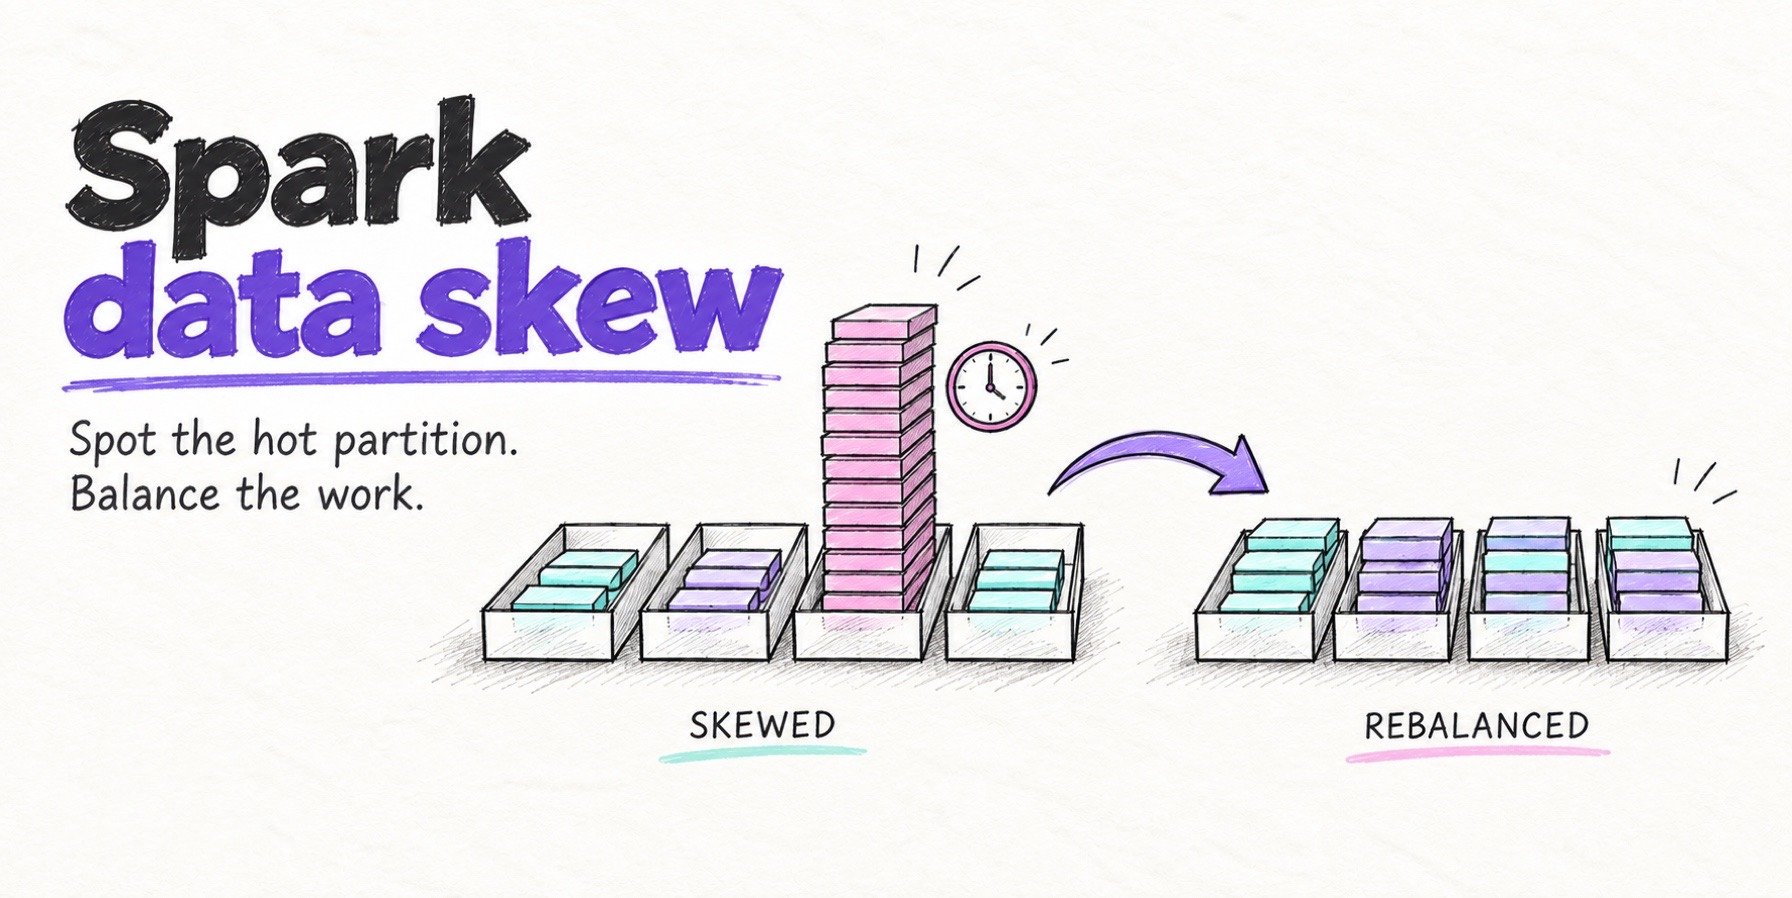
The median task read 1.75 million records and the slowest read 6.88 million, and it took more than twice as long. That’s skew: the window sends every row for one customer to a single task. The same task spilled 652 MiB, ten times the median, because its rows didn’t fit in execution memory. Adaptive query execution only splits skewed partitions for joins, so for a window the fix belongs in the job: handle the hot key separately or window on a finer key. Our guides to data skew and Spark performance tuning cover the options.
The Executors page shows whether garbage collection is the problem:
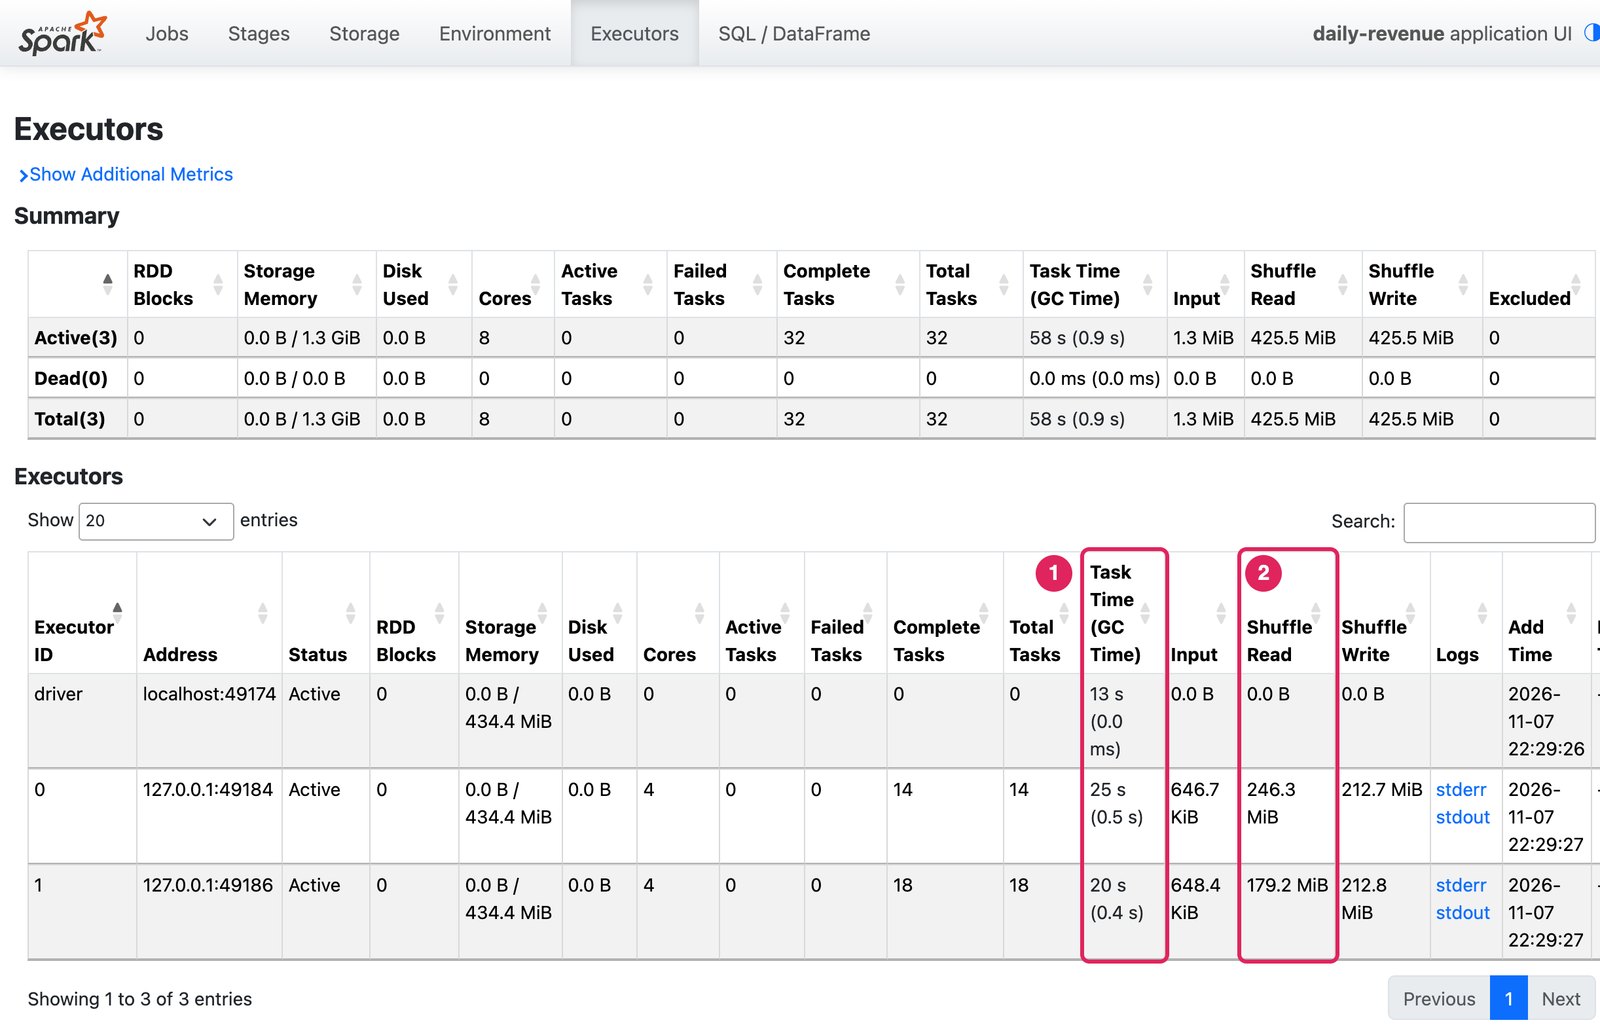
GC took 0.5 s of executor 0’s 25 s of task time, about 2%, which is healthy. The UI turns that cell red when GC passes 10% of task time, and at that point executor memory or object churn is worth a look before anything else. Executor 0 also read 67 MiB more shuffle data than executor 1, because it ran the skewed task.
The SQL page shows the physical plan that actually ran, with row counts on every edge. This is the revenue query from a second run of the same job:
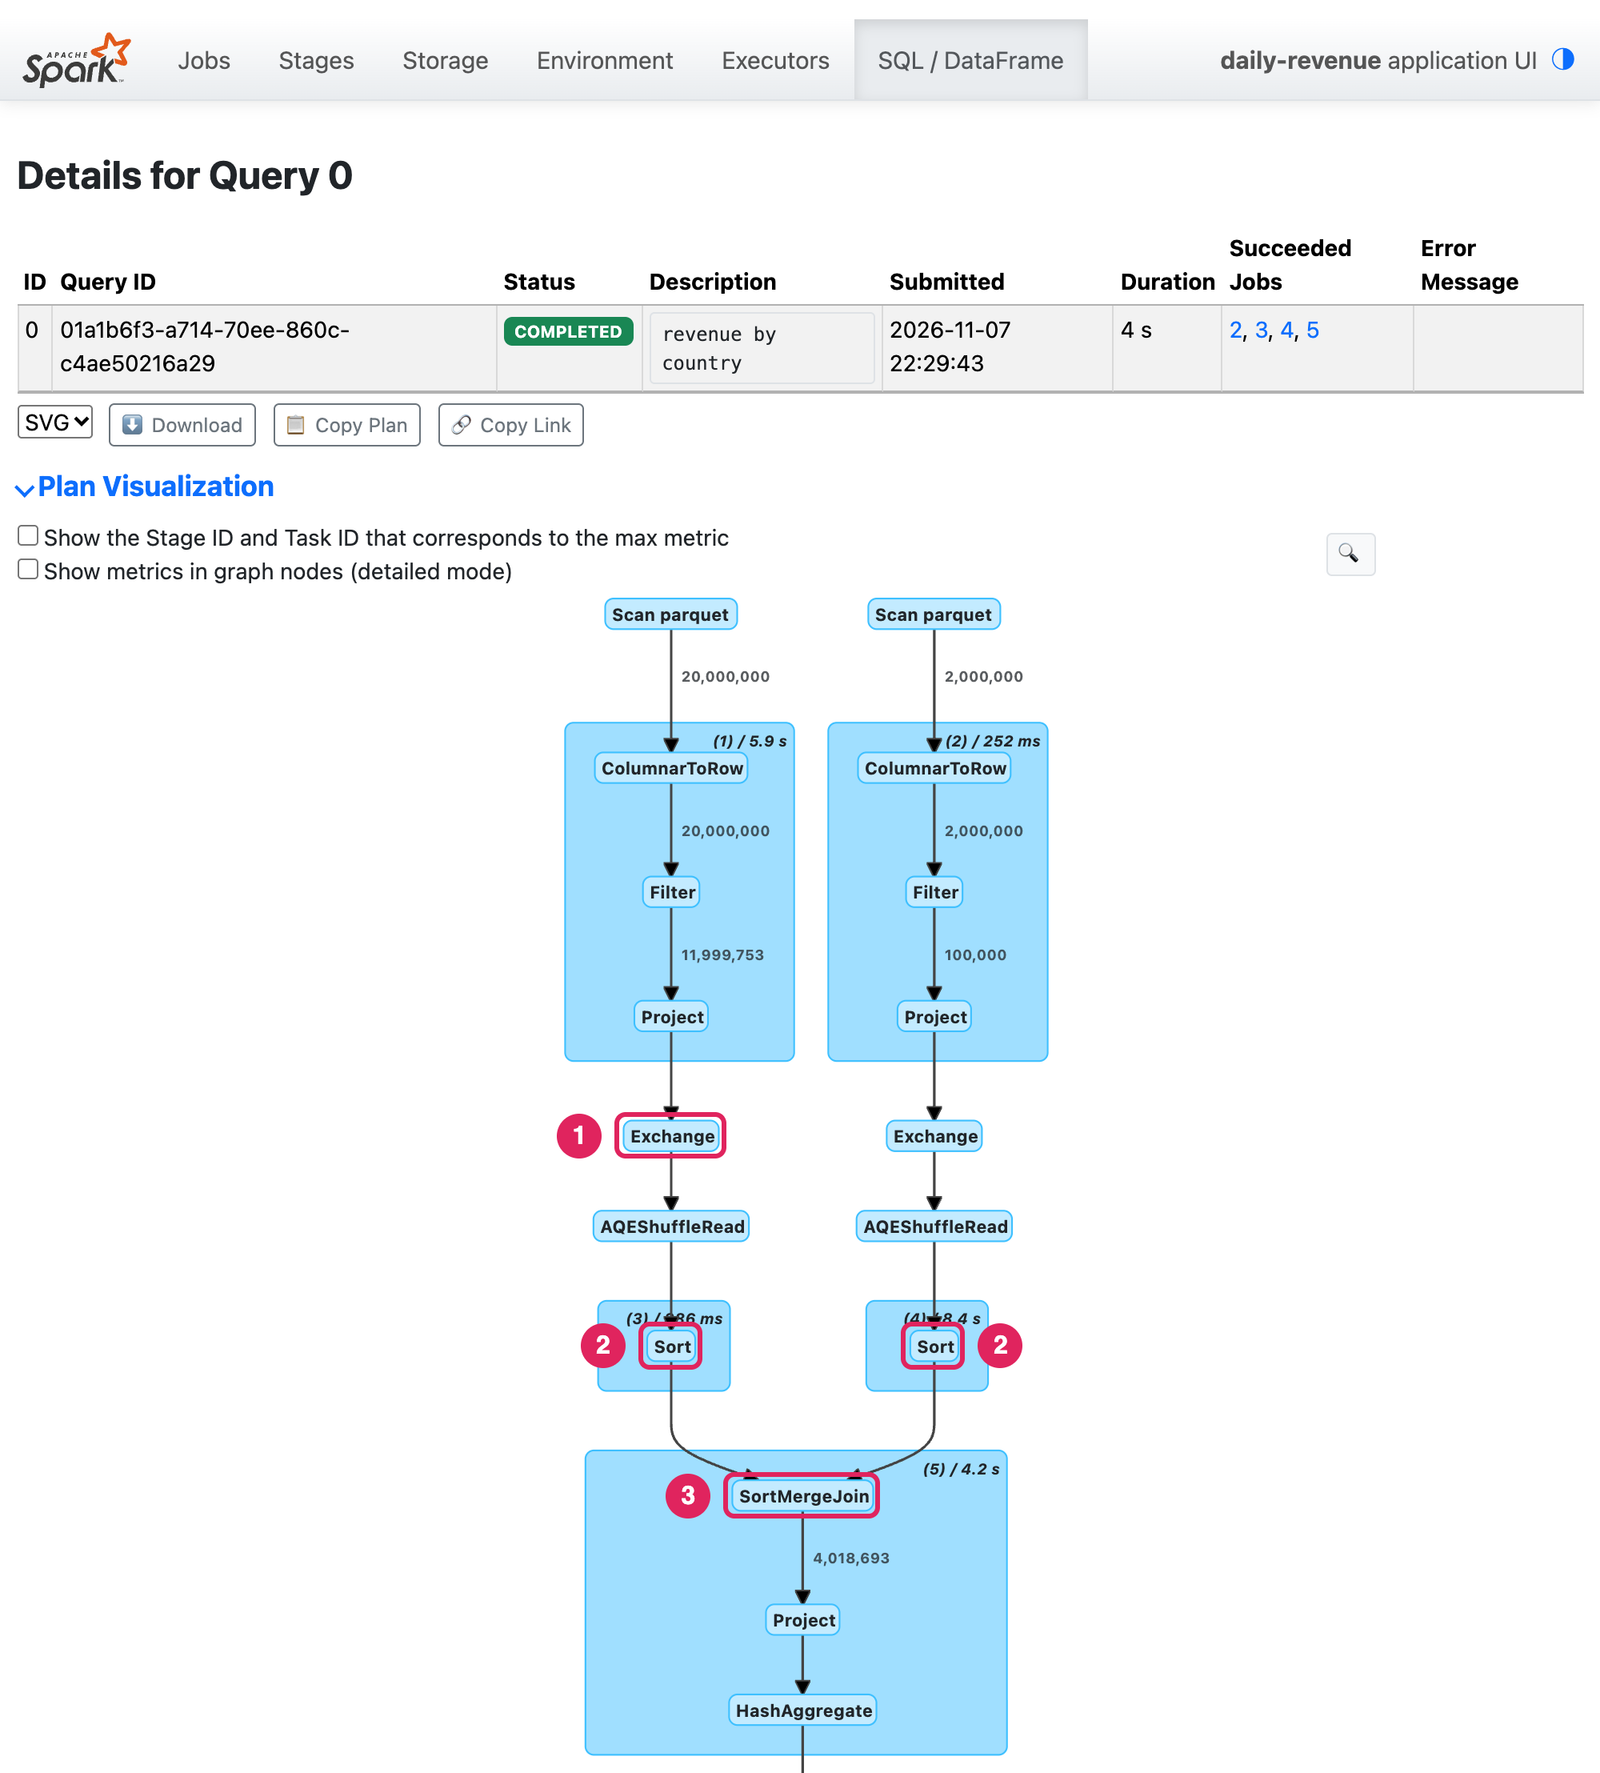
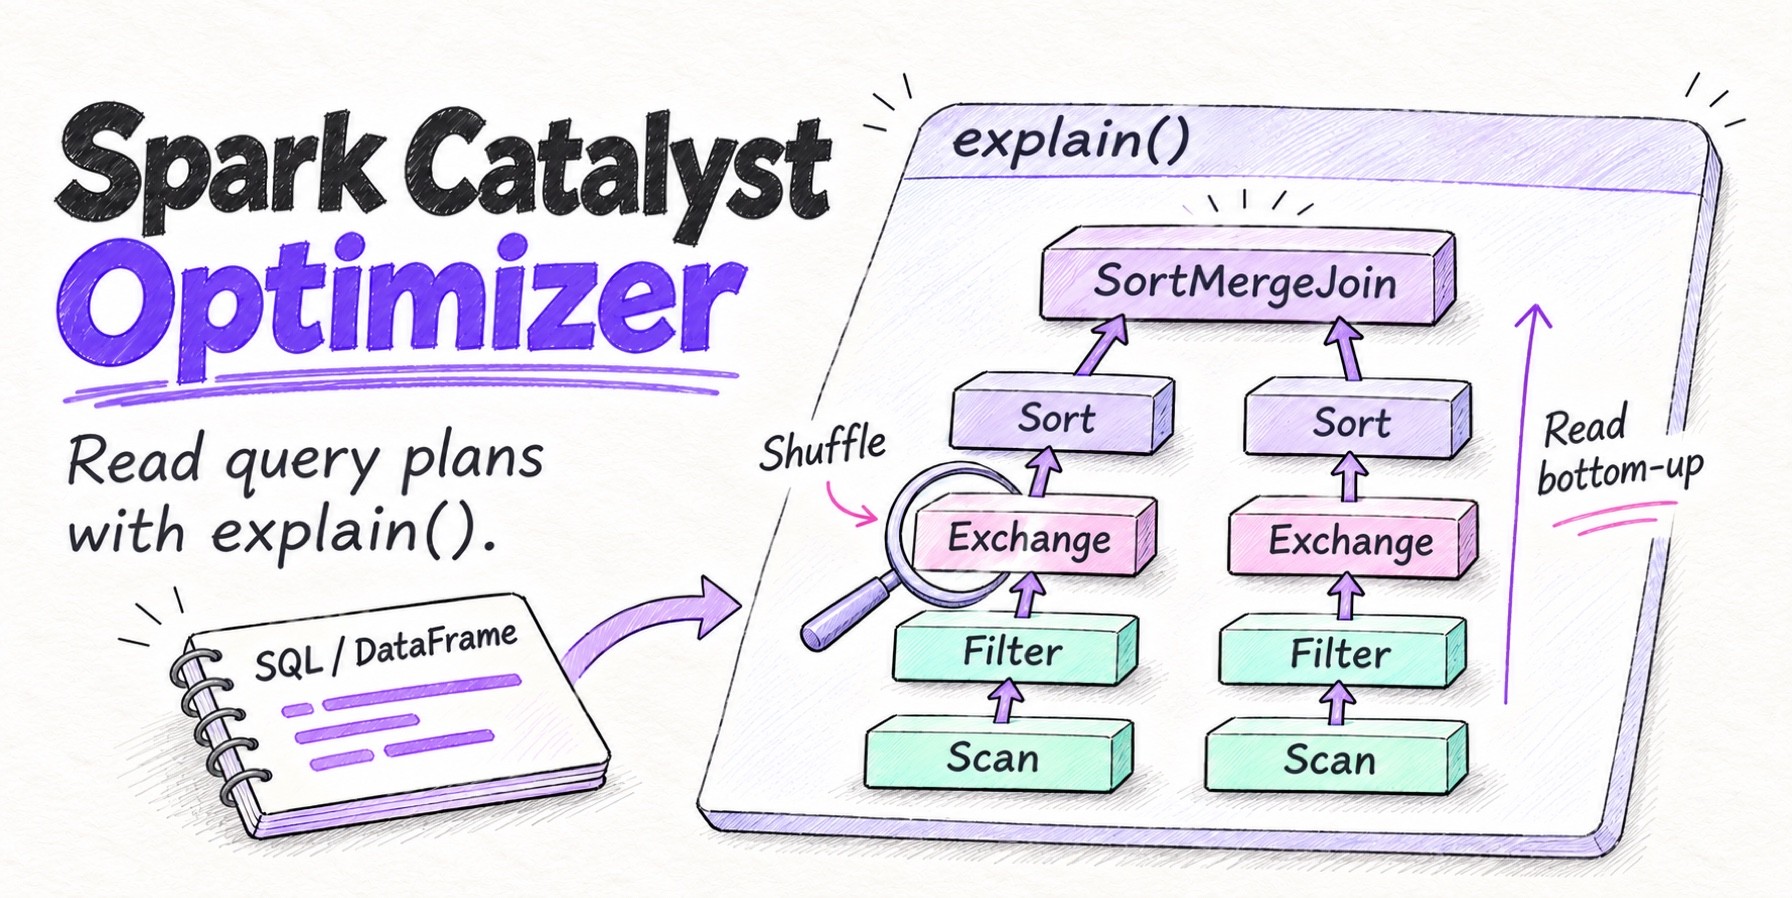
Here 11,999,753 order rows went through a shuffle and a sort to meet 100,000 customers in a SortMergeJoin. In the first run, the same query broadcast the customers and never shuffled the orders. Our guide to the Catalyst optimizer and explain() explains how to read these plans.
Comparing runs
The second daily-revenue run took longer than the first, and the plan above hints at why. Opening both runs in two browser tabs works once. The REST API makes the comparison repeatable. It’s mounted at /api/v1, and these endpoints cover most post-mortems:
| Endpoint | Returns |
|---|---|
/applications?status=completed |
Finished applications with IDs, names and durations |
/applications/{app-id}/stages/{stage-id}/{attempt}/taskSummary?quantiles=0.5,1.0 |
The summary metrics table as JSON |
/applications/{app-id}/sql |
Each query’s duration and plan nodes |
/applications/{app-id}/allexecutors |
Active and dead executors, with removal reasons |
/applications/{app-id}/environment |
Spark properties the run used |
/applications/{app-id}/logs |
The event logs as a zip file |
Find the two runs:
curl -s 'http://localhost:18080/api/v1/applications?status=completed'[ {
"id" : "app-20261107222941-0000",
"name" : "daily-revenue",
"attempts" : [ {
"startTime" : "2026-11-07T16:59:40.707GMT",
"endTime" : "2026-11-07T16:59:54.729GMT",
"duration" : 14022,
"completed" : true,
"appSparkVersion" : "4.3.0",
...This script lists each query’s duration and join operators for two runs and prints any spark.sql.* setting that differs:
import json
import sys
from urllib.request import urlopen

API = "http://localhost:18080/api/v1/applications"

def get(path):
    with urlopen(f"{API}/{path}") as r:
        return json.load(r)

def queries(app):
    out = {}
    for q in get(f"{app}/sql?details=true&planDescription=false"):
        names = {n["nodeName"] for n in q["nodes"]}
        joins = sorted(n for n in names if "Join" in n)
        out[q["description"]] = (q["duration"], ", ".join(joins) or "-")
    return out

def spark_props(app):
    return dict(get(f"{app}/environment")["sparkProperties"])

old, new = sys.argv[1], sys.argv[2]
qa, qb = queries(old), queries(new)
for desc in qa:
    (ta, ja), (tb, jb) = qa[desc], qb[desc]
    flag = "  <- plan changed" if ja != jb else ""
    print(f"{desc:28} {ta:>6} ms {ja:18} -> {tb:>6} ms {jb}{flag}")

pa, pb = spark_props(old), spark_props(new)
for k in sorted(set(pa) | set(pb)):
    if k.startswith("spark.sql.") and pa.get(k) != pb.get(k):
        before = pa.get(k, "(default)")
        print(f"config changed: {k}: {before} -> {pb.get(k)}")
$ python compare_runs.py app-20261107222926-0000 app-20261107222941-0000
revenue by country 2463 ms BroadcastHashJoin -> 3538 ms SortMergeJoin <- plan changed
running spend per customer 7704 ms - -> 7384 ms -
config changed: spark.sql.autoBroadcastJoinThreshold: (default) -> -1Someone had set spark.sql.autoBroadcastJoinThreshold to -1 on the second run, which turns broadcast joins off. The revenue query went from a broadcast to a sort-merge join and from 2.5 to 3.5 seconds, and its stages went from shuffling 5.4 KiB to shuffling 119 MiB of orders and spilling 288 MiB. The Environment page shows the same change. In Spark 4.3 it lists each property’s default next to the value the run used and highlights the ones that differ:
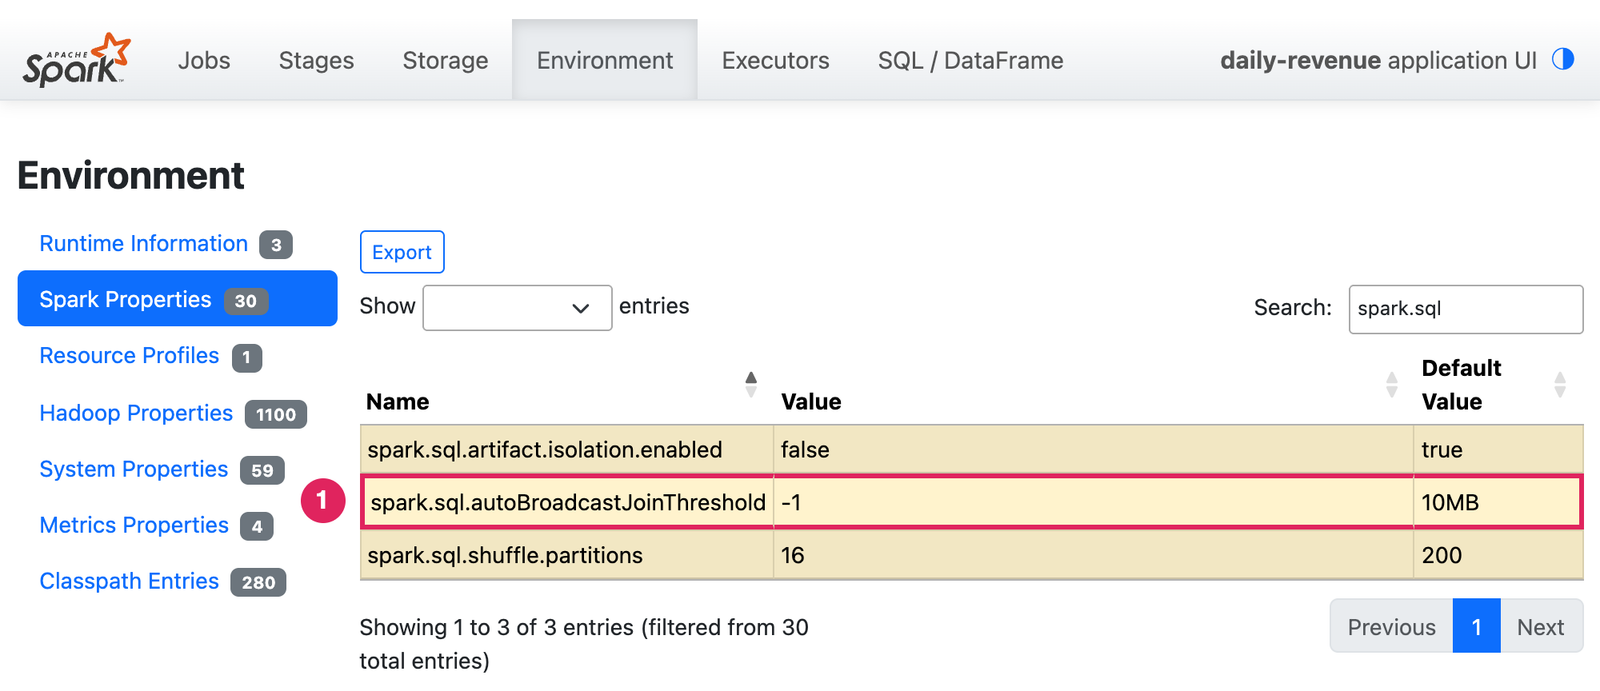
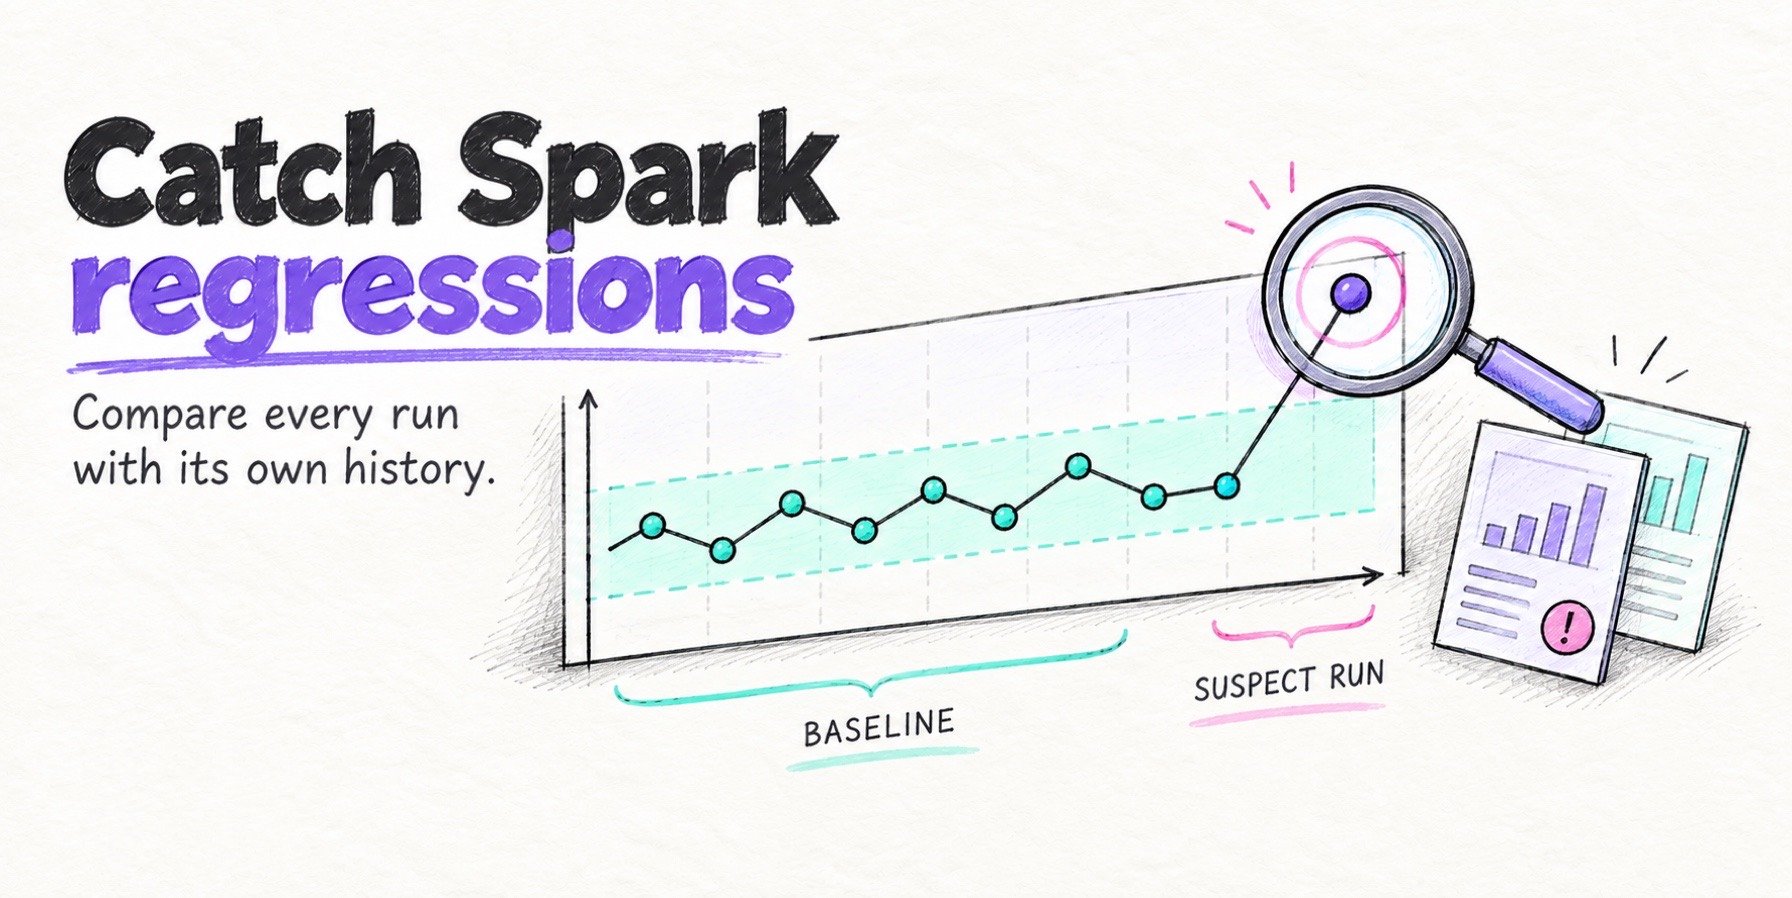
The same check catches a plan that changes after a Spark upgrade. Run the job on both versions, point the script at the two application IDs, and any query whose join operators differ is flagged, the same way our post on catching Spark performance regressions across runs does at scale.
Onehouse tools that read the History Server
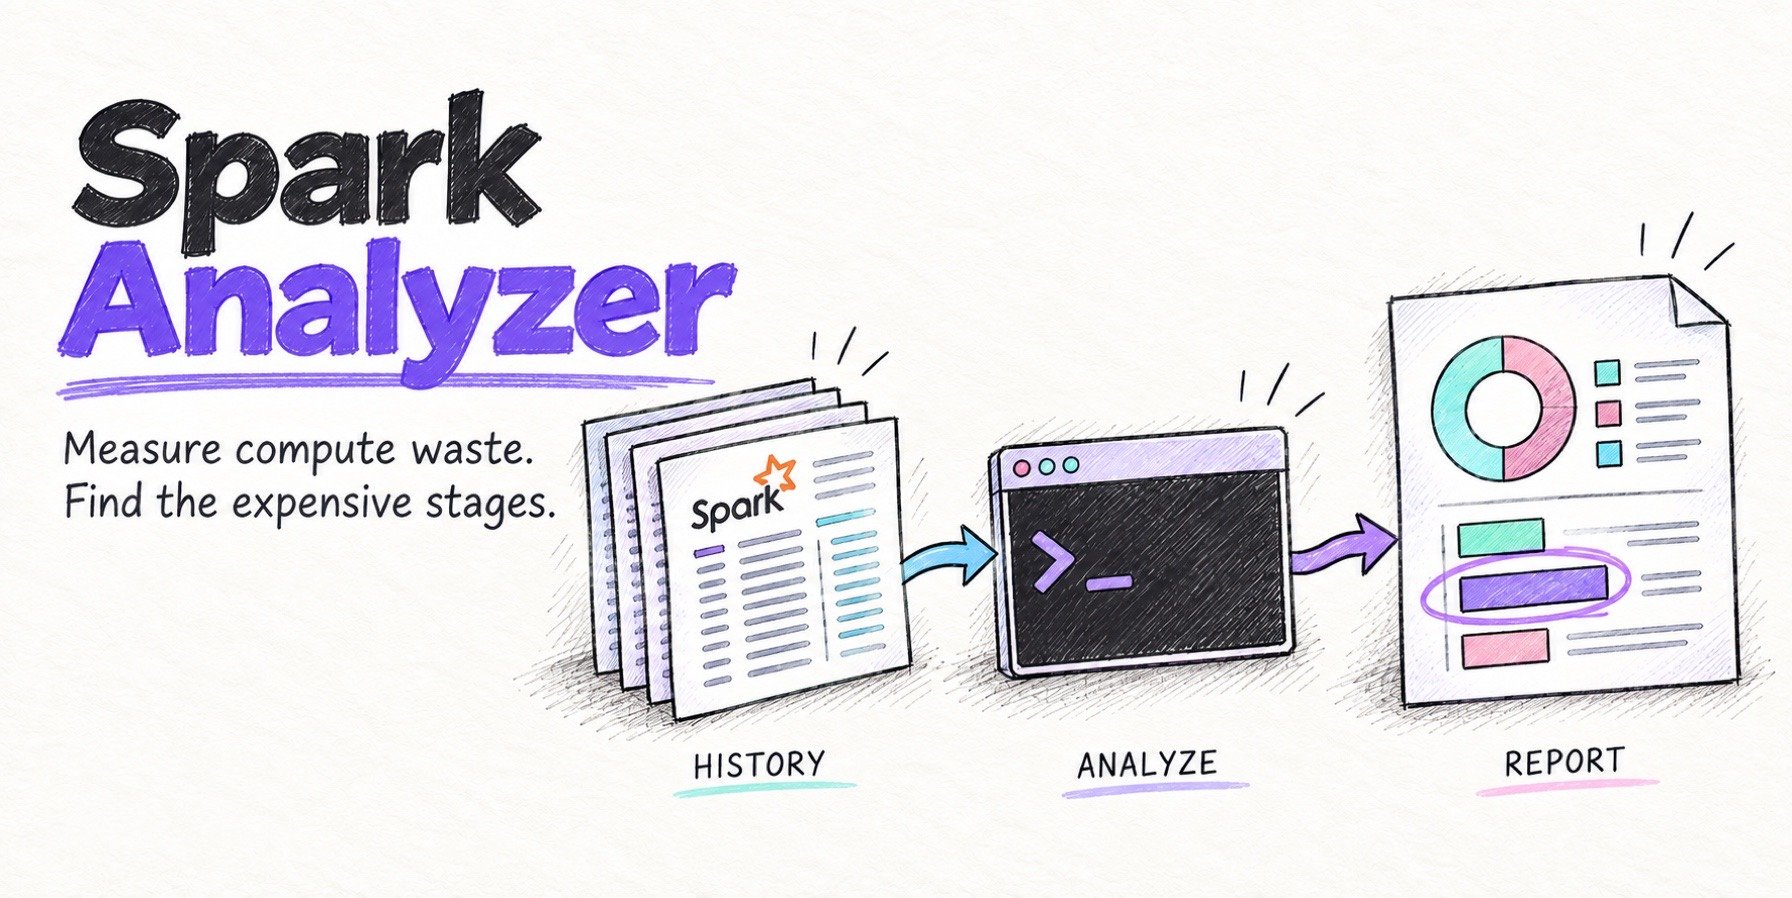
Two Onehouse tools build on the History Server. Spark Analyzer is a free command-line tool that analyzes completed applications through the History Server API and reports wasted executor time per application and stage. For jobs on Quanton, the Spark engine from Onehouse available on its own at quanton.dev, the AI Spark Engineer runs inside the Spark UI of a running job and can use a connected History Server to find earlier runs of the same job, compute a P50 and P95 baseline, and flag whether the current run is a regression. Quanton can be used without the Onehouse platform, and you can create an account to try it.
Limits and troubleshooting
- Applications stuck as incomplete. We killed the driver of an
hourly-sessionizejob mid-run. Itsappstatusfile kept the.inprogresssuffix, and the run sits under Show incomplete applications until the cleaner removes it. The docs’ fix is to stop the session explicitly, so callspark.stop()in afinallyblock. - Large logs open slowly. The server parses an application’s whole log the first time you open it. Raise
SPARK_DAEMON_MEMORY, setspark.history.store.path, and keep rolling on.spark.history.retainedApplications(50) caps how many parsed UIs stay in memory. - What it can’t show. Why a pod or container died (an OOM kill, an eviction, a lost spot instance) is in the cluster manager’s logs. Thread dumps exist only in the live UI. The Storage page is usually empty because block updates aren’t logged by default, and executor log links break once the cluster manager deletes those logs.
- Applications missing after a path change. The server only lists what’s under
spark.history.fs.logDirectory. If jobs start writing elsewhere, add the new path: since Spark 4.2 the setting accepts a comma-separated list, and the home page gains a log source filter. Check that the server can read the new location, and use the home page’s Show server log link to see parsing errors.
FAQs
What is the Spark History Server?
It’s a web server that rebuilds the Spark UI for finished applications from their event logs. It shows the same Jobs, Stages, SQL, Executors and Environment pages as the live UI, after the driver and cluster are gone, and serves the same data as JSON through a REST API under /api/v1.
What port does the Spark History Server use?
Port 18080 by default, set with spark.history.ui.port. The live Spark UI of a running application uses port 4040 on the driver.
Why doesn’t my application show up in the Spark History Server?
Either the job didn’t write an event log, or it wrote one somewhere the server isn’t reading. Check that spark.eventLog.enabled is true and that spark.eventLog.dir matches spark.history.fs.logDirectory. If the run appears only under incomplete applications, its driver exited without stopping the session.
How long does the Spark History Server keep applications?
As long as their event logs exist. The cleaner is off by default, so logs stay until you delete them. With spark.history.fs.cleaner.enabled set to true, the server deletes logs older than spark.history.fs.cleaner.maxAge, 7 days by default. Managed platforms set their own retention, such as 30 days on Amazon EMR.