Talk with our engineers by joining the new Onehouse community Slack!
TL;DR
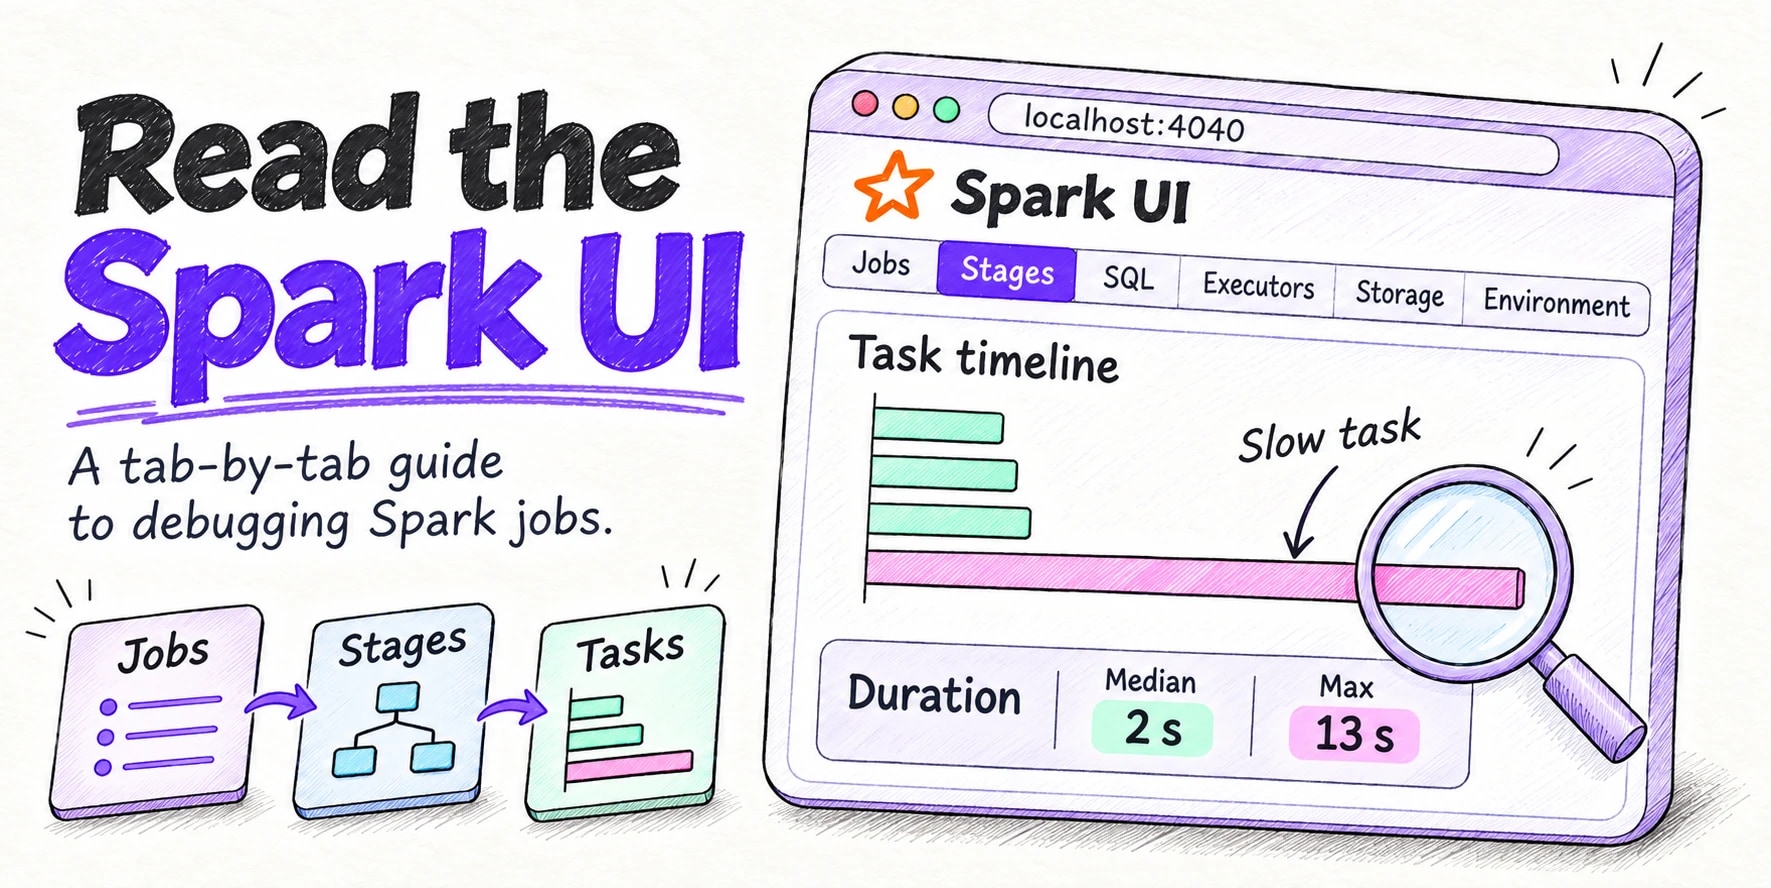
The Spark UI is the web interface every Spark application serves on port 4040 while it runs. Start in the Jobs tab to find the longest or failed job, follow it to its slowest stage in the Stages tab, and compare the median and max columns of that stage's Summary Metrics to spot skew and spill. The SQL / DataFrame tab shows the physical plan with row counts, shuffles and join strategies. The Executors tab shows GC time, failed tasks and lost executors, Storage shows cached data, and Environment shows the configuration the application started with. After the application ends, the Spark History Server on port 18080 rebuilds the same pages from event logs.
The Spark UI is the web interface built into every Apache Spark™ application. While the application runs, the driver serves it on port 4040, and it shows what your code turned into: jobs, stages, tasks, query plans, executors, cached data and configuration. When a job is slow or fails, the evidence is almost always on one of its tabs. The hard part is knowing which numbers to read.
This guide goes through the Spark UI tab by tab, asking what each one shows and what to look for, then traces one slow query to its cause and fixes it. Every screenshot comes from Spark 4.3.0 running a small demo job on a two-executor local cluster. Older versions have the same tabs, and we point out the panels that differ.
What the Spark UI is
The Spark web UI belongs to one application. The driver serves it, so it lives exactly as long as the driver does. You’ll meet it in two forms:
- The live UI runs on the driver, on port 4040 by default, while the application is running. It updates as tasks finish and offers a few things only a live process can, such as thread dumps.
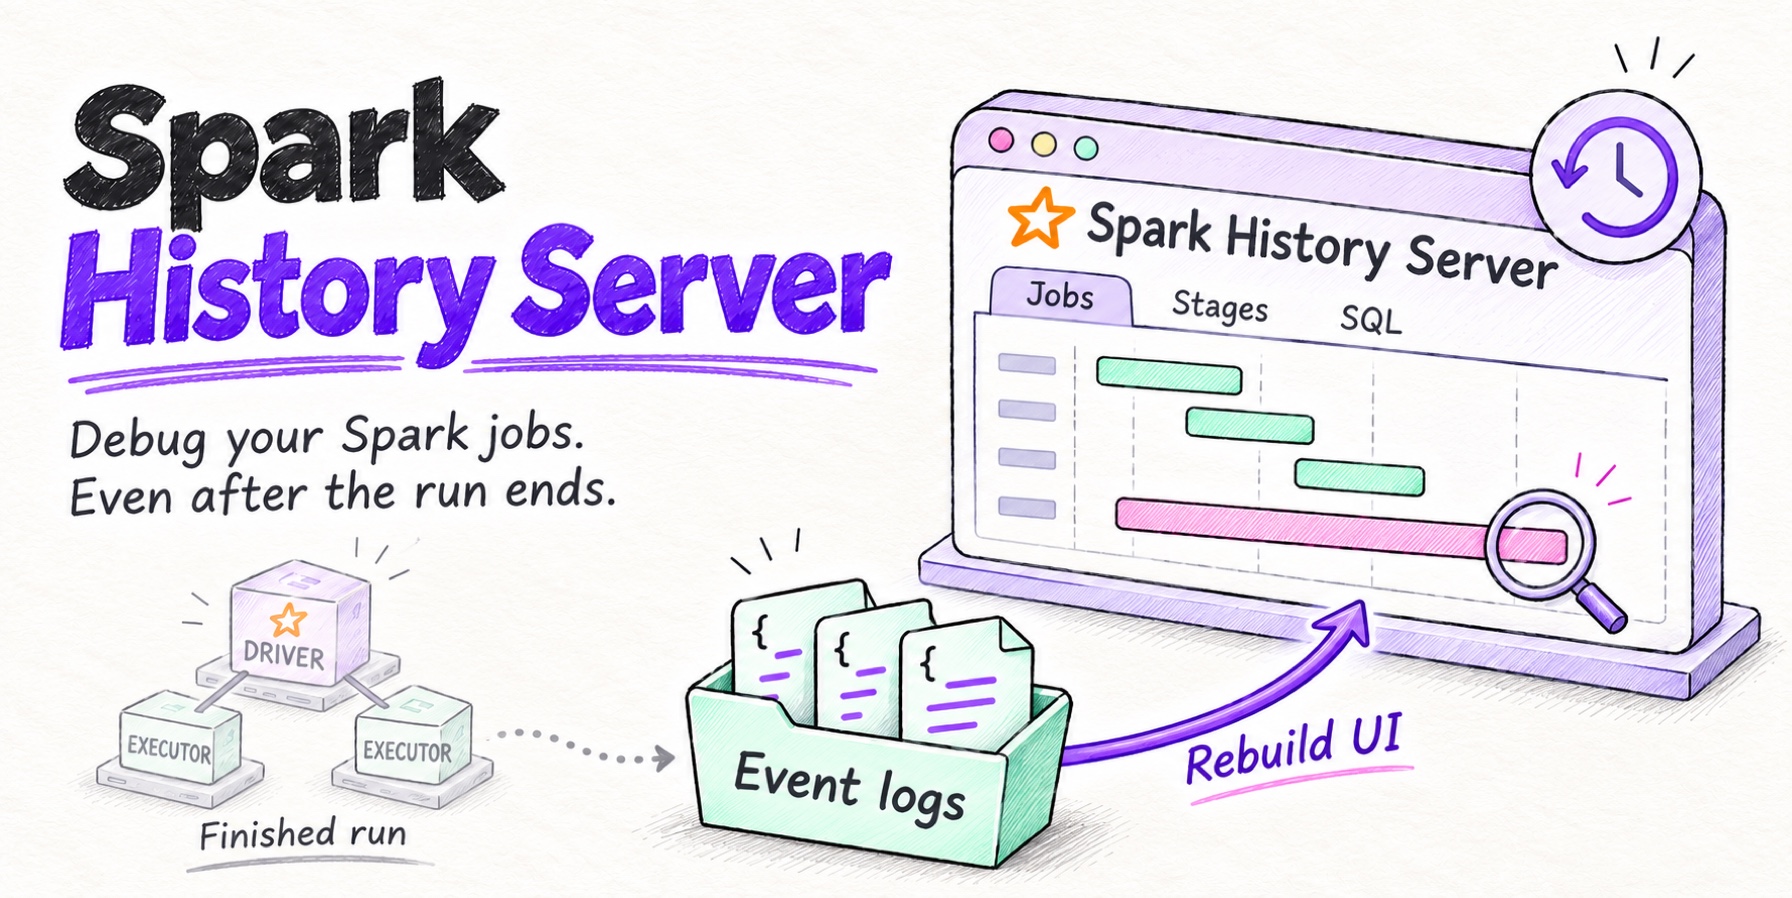
- The Spark History Server is a separate server, on port 18080, that rebuilds the same pages from event logs after the application has ended. Our Spark History Server guide covers it in depth.
Everything below applies to both unless we say otherwise.
Spark execution basics: Application, job, stage and task
The tabs follow the way Spark breaks work down, so four terms come first.
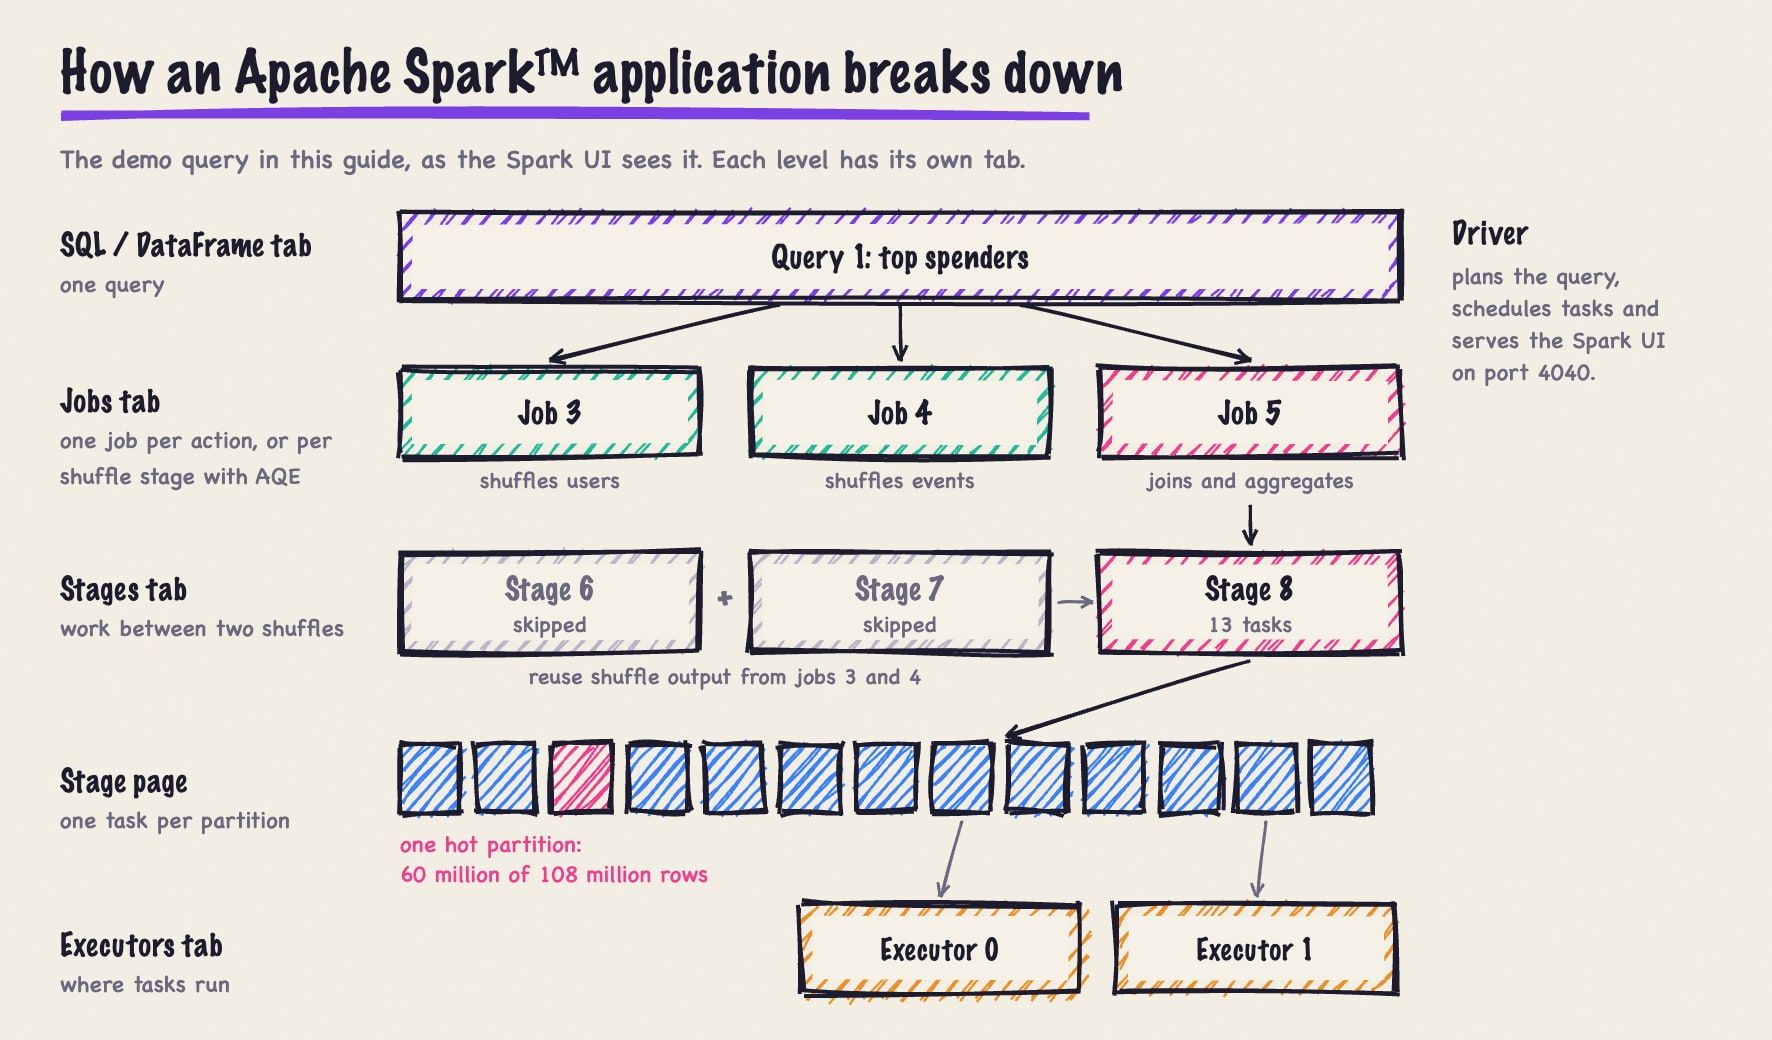
- Application: one driver and its executors. One application has one Spark UI.
- Job: the work triggered by one action, such as
count(),show()or a write. With adaptive query execution (AQE), which has been on by default since Spark 3.2, Spark SQL submits each shuffle stage of a query as its own job. One query often shows up as several jobs. - Stage: a set of tasks that run the same code without a shuffle in between. Every shuffle ends one stage and starts another.
- Task: one stage’s work on one partition, running on one executor core. A stage that reads 200 partitions has 200 tasks.
A stage marked skipped didn’t have to run, because the shuffle output it would produce already existed.
A demo job that fills every tab
This PySpark script caches a table of 8 million users, then finds the top spenders by joining 100 million events to it. One user owns 60% of the events, which gives us a deliberately skewed key.
from pyspark.sql import SparkSession, functions as F

spark = SparkSession.builder.appName("spark-ui-demo").getOrCreate()
sc = spark.sparkContext

# 8 million users, cached so the Storage tab has something to show
countries = F.array(*[F.lit(c) for c in ["US", "DE", "IN", "BR", "JP"]])
users = (
    spark.range(1, 8_000_001).withColumnRenamed("id", "user_id")
    .withColumn("country", countries[F.col("user_id") % 5])
    .withColumn("email", F.format_string("user%d@example.com", "user_id"))
)
users.cache()
sc.setJobDescription("cache users")
users.count()

# 100 million events, and 60% of them belong to user 1: the skewed key
events = (
    spark.range(0, 100_000_000).withColumnRenamed("id", "event_id")
    .withColumn("user_id",
                F.when(F.rand(7) < 0.6, F.lit(1))
                .otherwise((F.rand(11) * 8_000_000).cast("long") + 1))
    .withColumn("amount", F.rand(3) * 100)
)

# Top spenders: join first, then aggregate per user
sc.setJobDescription("top spenders")
(events.join(users, "user_id")
 .groupBy("user_id", "email").agg(F.sum("amount").alias("spend"))
 .orderBy(F.desc("spend")).limit(10)
 .show(truncate=False))

input("Done. The Spark UI stays up until you press Enter. ")
spark.stop()
Run it with spark-submit spark_ui_demo.py. The input() call keeps the driver, and so the UI, alive after the query finishes. In local mode everything runs inside the driver, so the Executors tab lists a single row. To get separate executors on a laptop, we used the local cluster mode that the Spark distribution includes for testing, with two executors of four cores each:
spark-submit --master "local-cluster[2,4,1536]" \
  --conf spark.executor.memory=1g spark_ui_demo.py
How to open the Spark UI
On your machine or a cluster node. Open http://<driver-host>:4040, which is http://localhost:4040 for a local run. If that port is taken, usually by another Spark application on the same host, Spark tries 4041, 4042 and so on, up to spark.port.maxRetries (16) times, and logs the port it settled on. Our second run printed this:
WARN Utils: Service 'SparkUI' could not bind on port 4040. Attempting port 4041.
INFO Utils: Successfully started service 'SparkUI' on port 4041.
Set spark.ui.port to pin a port. On YARN, the ResourceManager’s page for the application links to the UI through its proxy.
After the application has finished. The live UI is gone, so you need event logs and a History Server:
spark.eventLog.enabled           true
spark.eventLog.dir               s3a://my-bucket/spark-events
spark.history.fs.logDirectory s3a://my-bucket/spark-events$SPARK_HOME/sbin/start-history-server.shThe server lists finished applications at http://<host>:18080. Setup, retention and production settings are in the History Server guide.
On Kubernetes. The driver pod serves the UI, and port forwarding brings it to your machine:
kubectl port-forward <driver-pod-name> 4040:4040Then open http://localhost:4040. The UI disappears when the driver pod completes, which is why Kubernetes jobs should write event logs to object storage. Our guide to running Spark on Kubernetes covers the full setup.
On managed platforms. Each platform puts the same UI behind its own console:
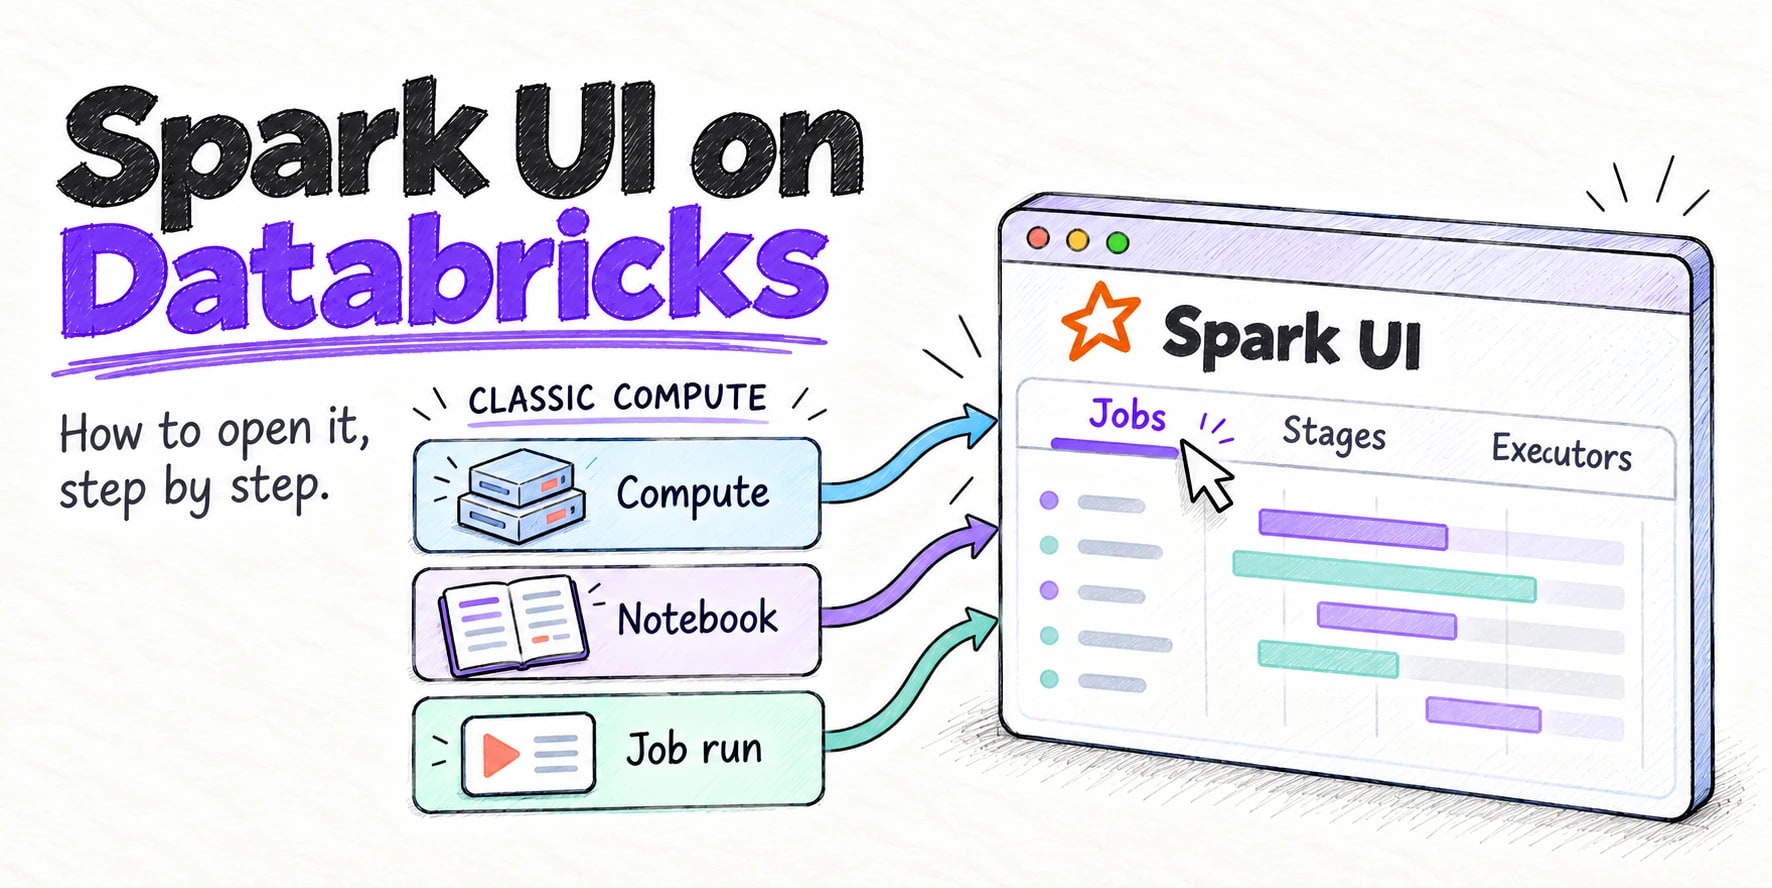
- Databricks: the Spark UI tab on a compute’s page, or View next to a job under a notebook cell. Serverless compute has no Spark UI. Steps are in how to access the Spark UI on Databricks.
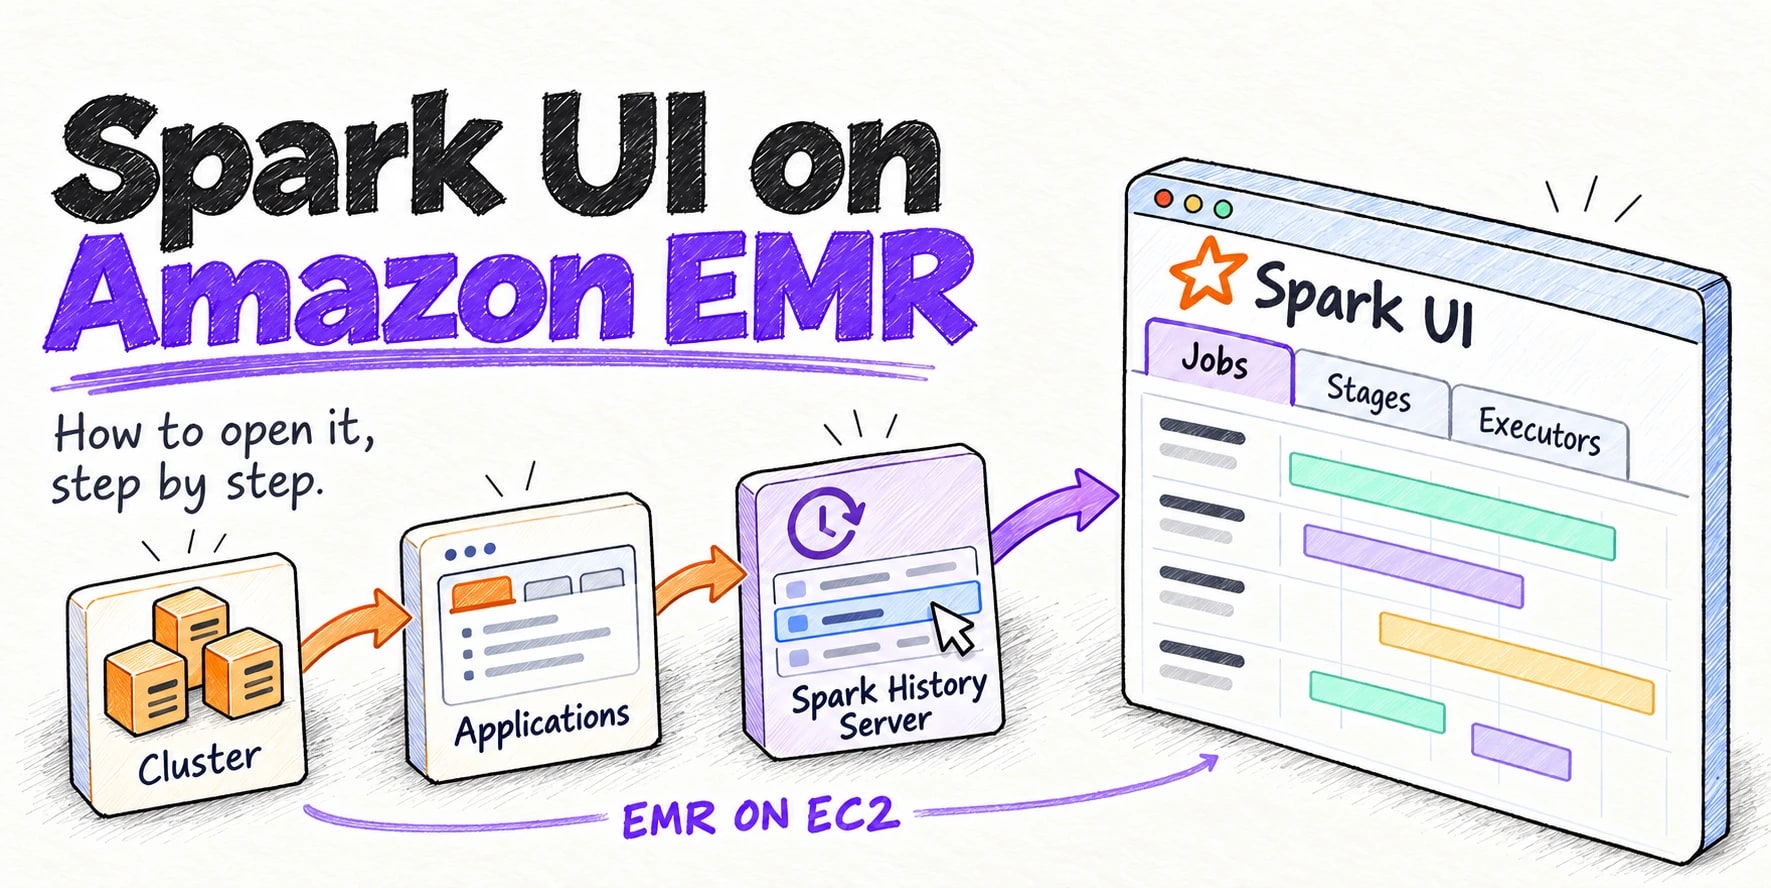
- Amazon EMR: the cluster’s Applications tab links to a hosted Spark History Server for running and terminated clusters, with no SSH tunnel. See how to access the Spark UI on Amazon EMR, which also covers EMR Serverless and EMR on EKS.
- AWS Glue: set the job parameters
--enable-spark-ui trueand--spark-event-logs-path, then open the Spark UI from the job run in the console. - Google Cloud Dataproc: the Component Gateway links to the YARN and Spark History Server UIs of a running cluster, and a Persistent History Server keeps them after the cluster is deleted.
The Jobs tab
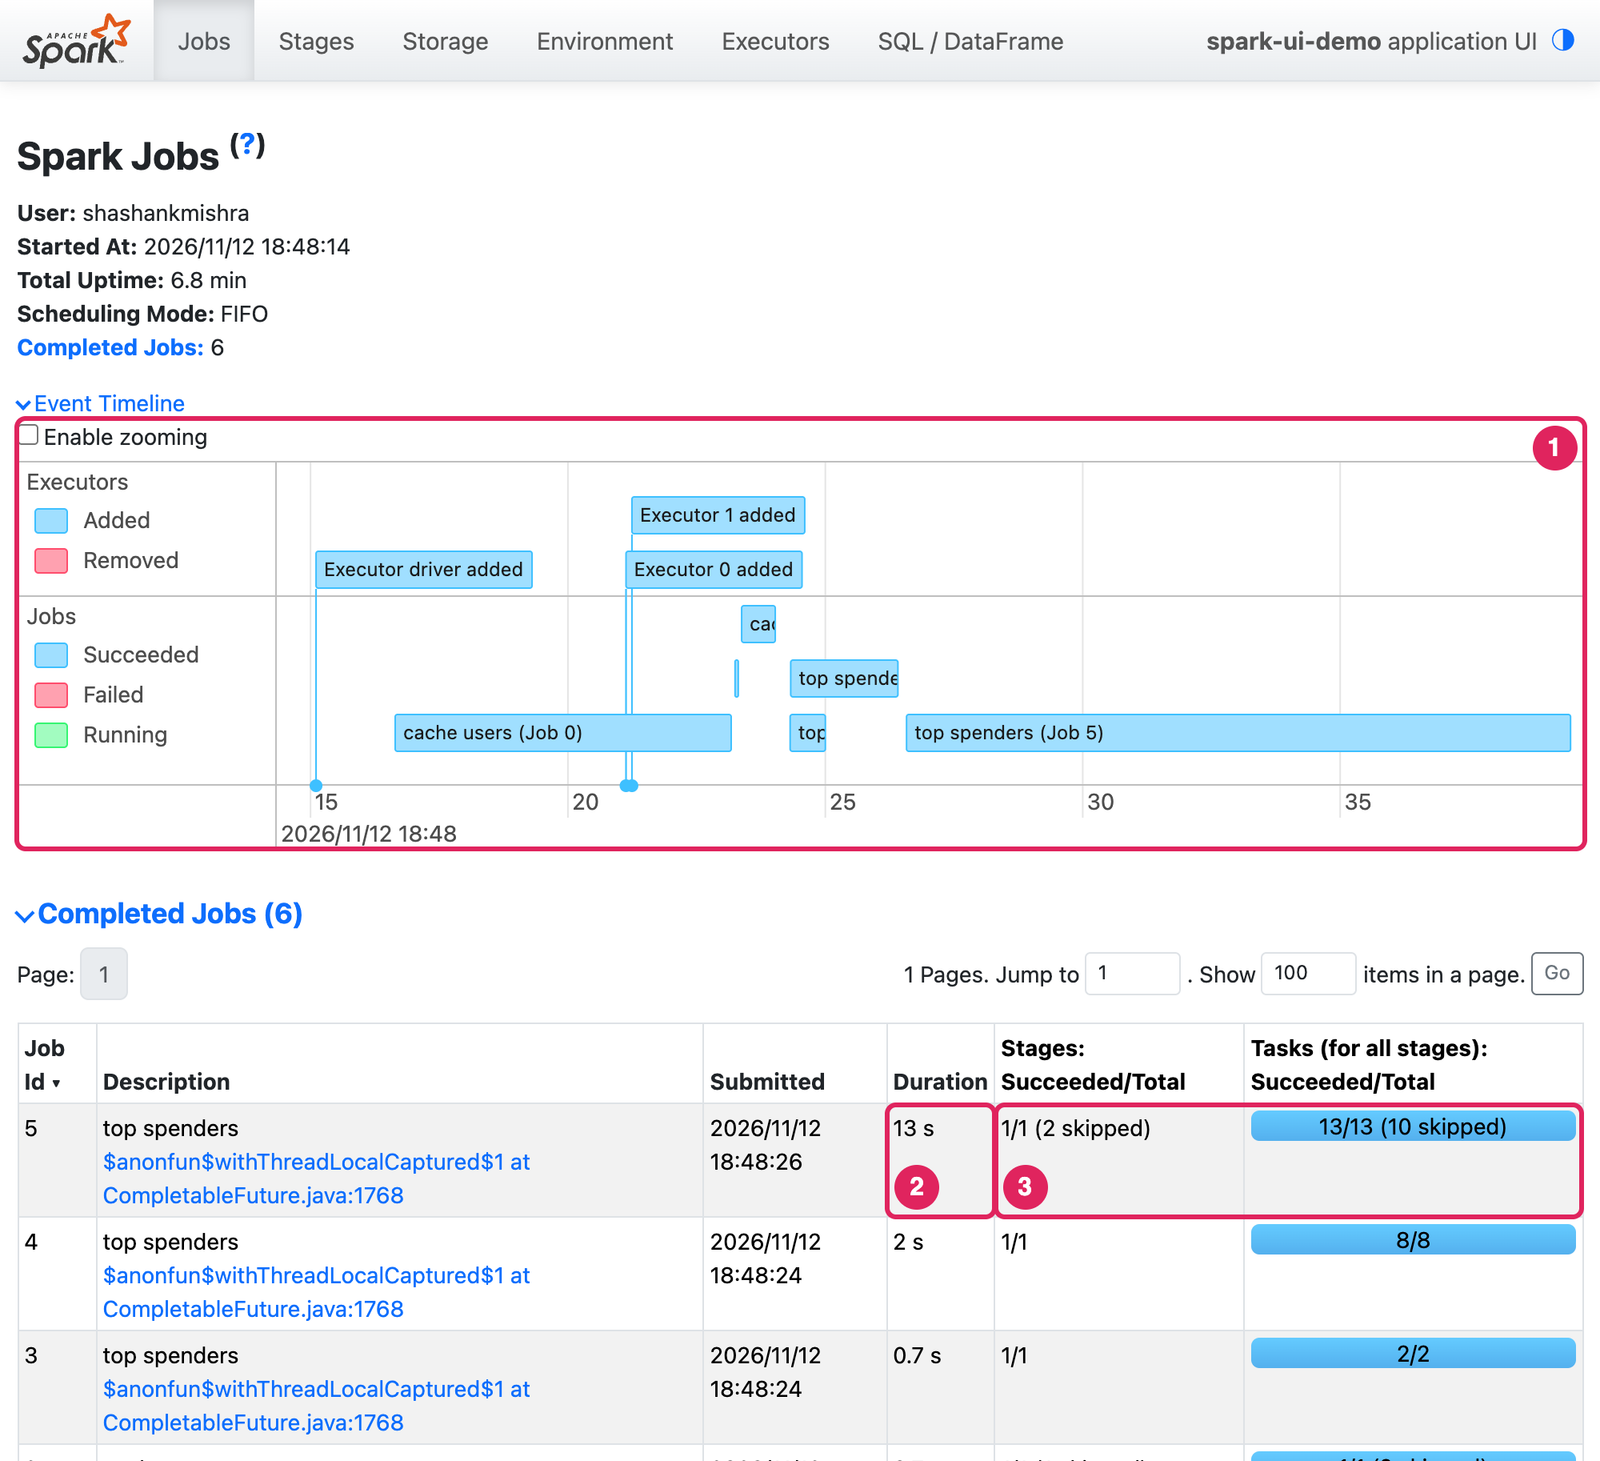
What it shows. The landing page lists every job with its description, submission time, duration, stage counts and a task progress bar, grouped into running, completed and failed. The collapsed Event Timeline above the table draws jobs and executor arrivals and removals on one time axis.
What to look for:
- The longest job. Click the Duration header to sort. Here job 5 took 13 s, most of the application’s run time.
- Failed jobs. They get their own table. Open one to find the stage that failed and its failure reason.
- Skipped work. Job 5 shows
1/1 (2 skipped)stages and13/13 (10 skipped)tasks. Jobs 3 and 4 had already written that shuffle output, so job 5 reused it. - Gaps in the timeline. Time when no job is running is time spent in the driver: planning, listing files or collecting results.
- Descriptions. Ours read “cache users” and “top spenders” because the script calls
sc.setJobDescription(). Without it you get a call site such ascount at DirectMethodHandleAccessor.java:103.
Click a job’s description to open its page, which lists its stages and draws them as a graph under DAG Visualization.
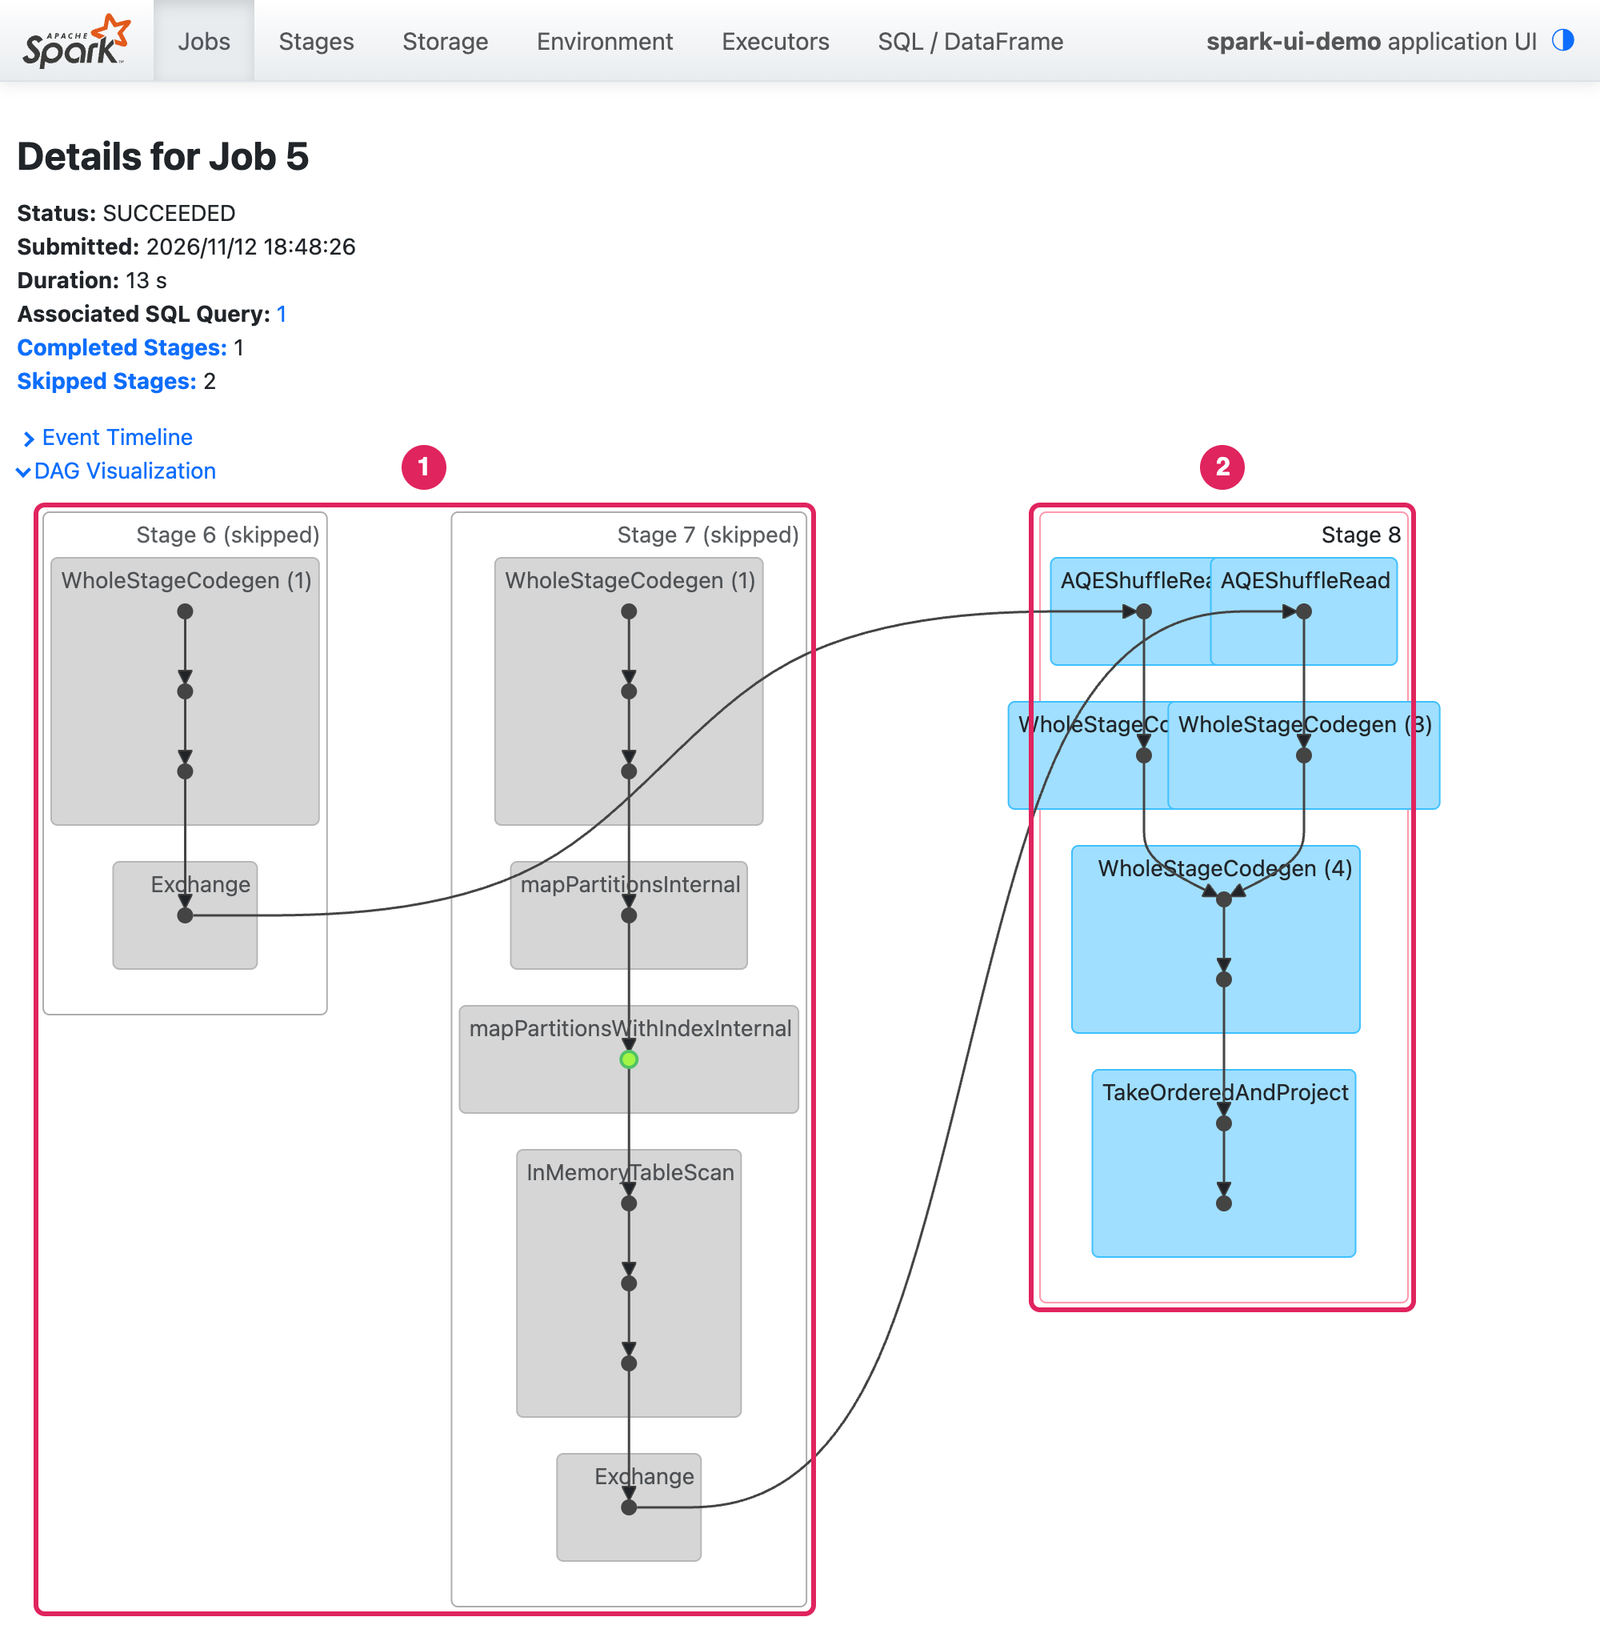
Each box is a stage, each dot is a dataset, and arrows that cross from one box to another are shuffles. Grey stages were skipped, and a green dot marks cached data. The Associated SQL Query link at the top jumps to the query this job belongs to.
The Stages tab
What it shows. Every stage of every job, with duration, task progress and four data columns: Input and Output are bytes read from and written to storage, and Shuffle Read and Shuffle Write are bytes moved between stages.
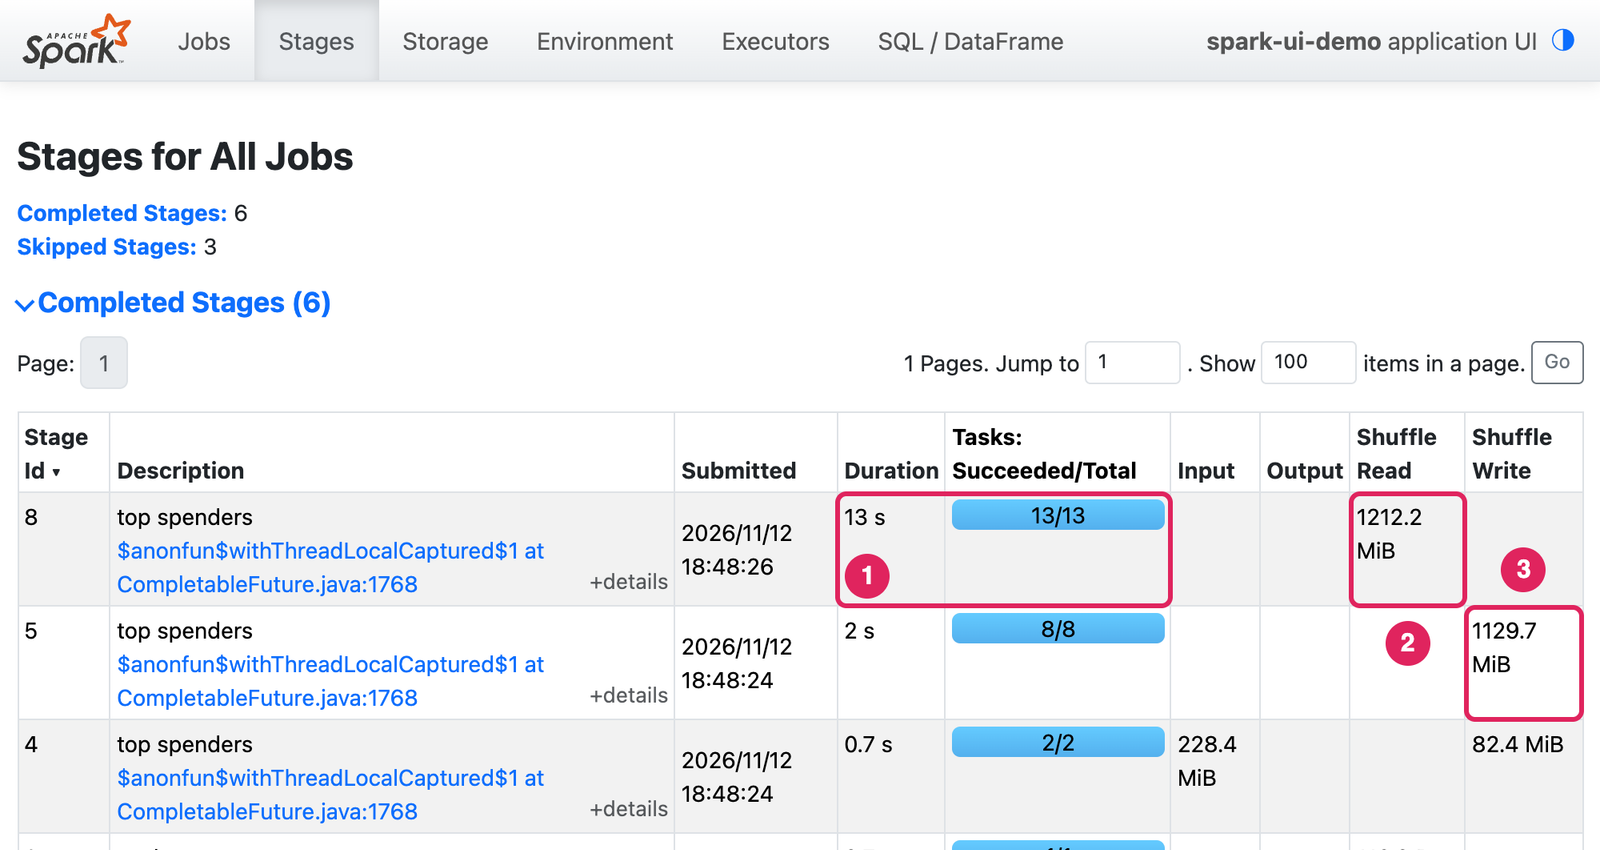
What to look for. Sort by Duration to find the slowest stage, and by the shuffle columns to find the stage that moves the most data. Stage 8 took 13 s and read 1,212.2 MiB of shuffle data, nearly all of it written by stage 5. A failed stage appears in its own table with a failure reason, and a stage that was rerun shows a retry count next to its name.
The stage page
Click a stage’s description to open the page that holds most of the answers. Stage 8’s header says the stage took 13 s, while Total Time Across All Tasks is 32 s. Eight cores could finish 32 s of evenly spread work in about 4 s, so one task must be holding the stage open. The Event Timeline confirms it:
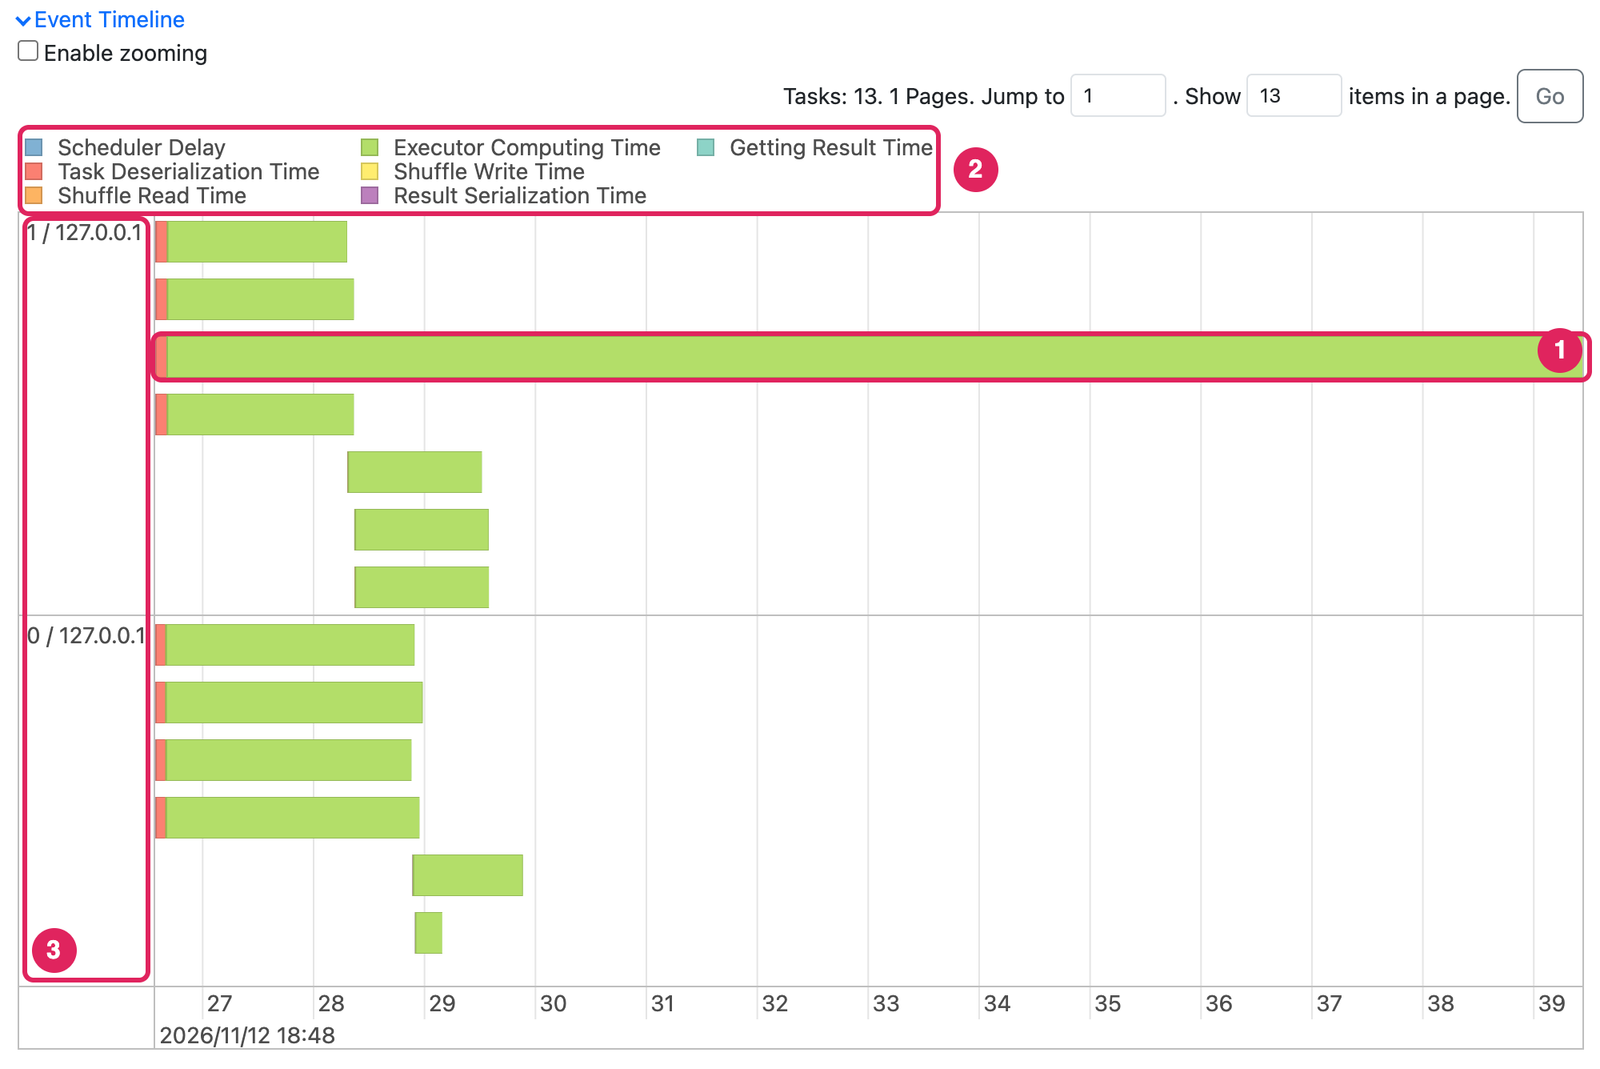
Each bar is a task, colored by where its time went:
- Mostly green (executor computing time) means the task was busy working. That includes sorting, spilling and garbage collection, so check those metrics next.
- Orange (shuffle read time) means it waited on shuffle fetches, which points at the network or at a struggling executor.
- Blue (scheduler delay) means it waited to be scheduled or to return its result. Thousands of tiny tasks or an overloaded driver cause that.
- Bars that start late show more tasks than cores. Here 13 tasks shared 8 cores, so 5 began only after the first ones finished.
The timeline draws at most 1,000 tasks, so for bigger stages rely on the table below it.
Summary Metrics is the most useful table in the Spark UI. It gives the minimum, 25th percentile, median, 75th percentile and maximum of every task metric:
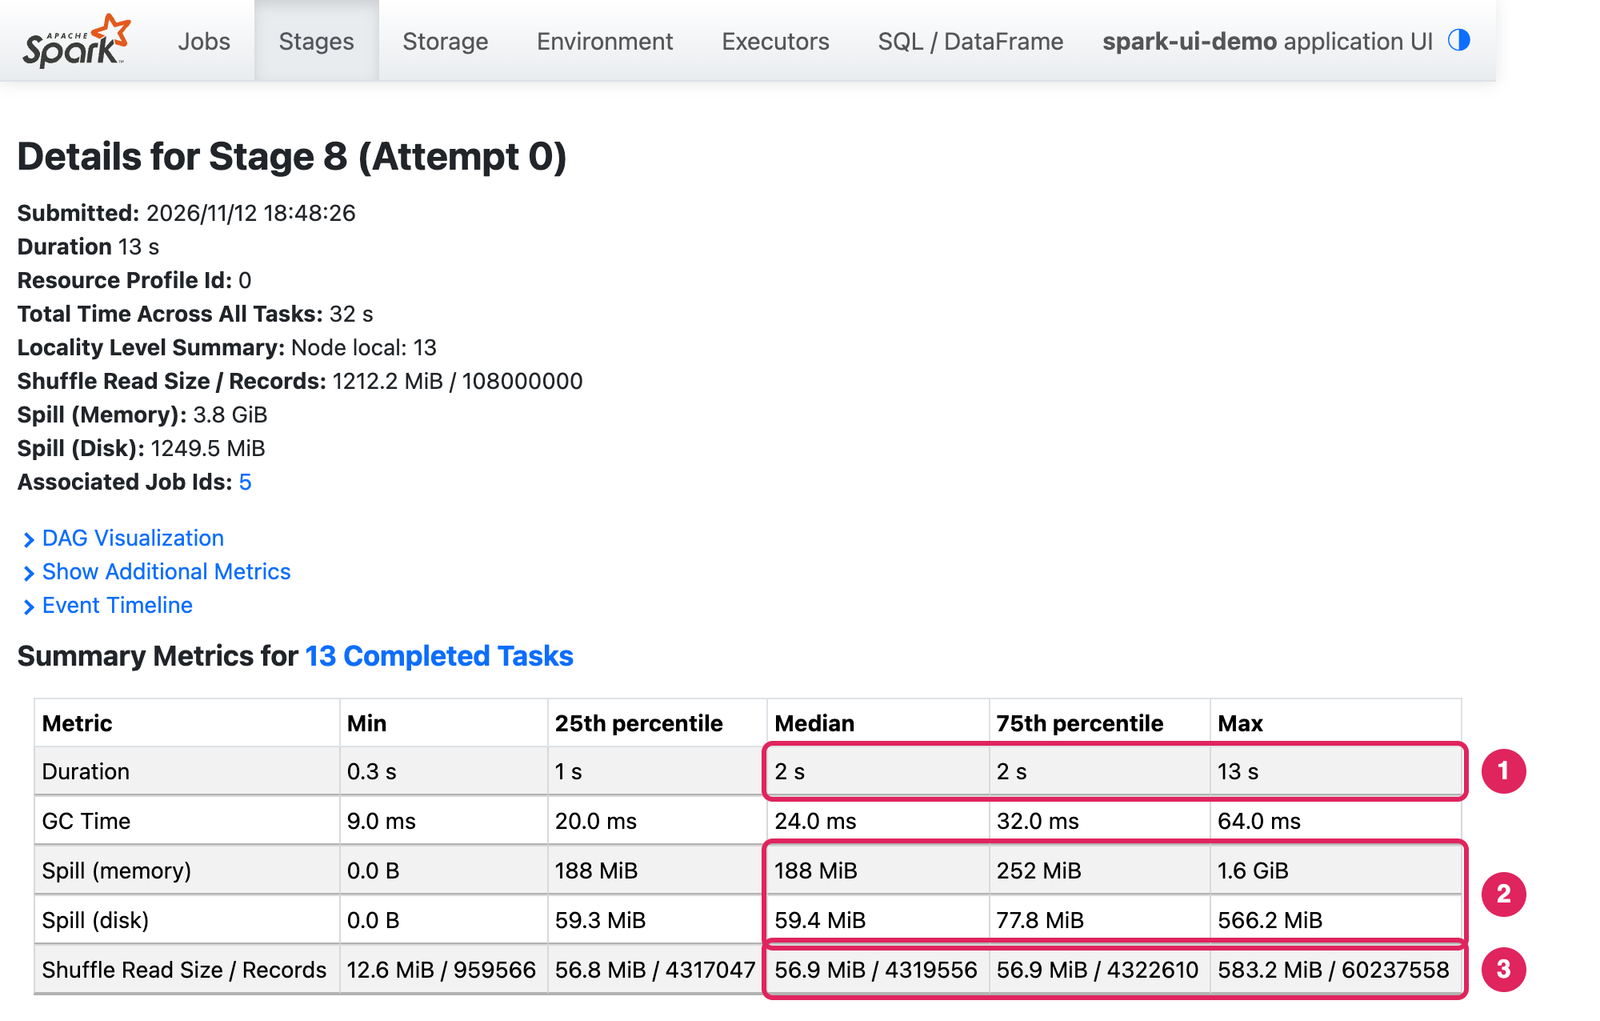
Read each row from Median to Max:
- Duration: 2 s against 13 s. When max is many times the median, a few tasks are doing most of the work.
- Shuffle Read Size / Records: 4,319,556 records against 60,237,558. One task received 14 times the rows of a typical one. That is data skew.
- Spill (memory) and Spill (disk): 188 MiB against 1.6 GiB in memory. Spill means a task’s data didn’t fit in its share of execution memory, so Spark sorted it in pieces on disk. The memory figure is the data’s size as objects in memory, and the disk figure is its serialized size.
- GC Time: 24 ms against 64 ms, which is negligible. A GC time that rivals the duration means the executor is short of memory.
Show Additional Metrics adds rows such as scheduler delay and peak execution memory. Below the summary, the task table lists every task with its executor, attempt number, metrics and error. Sort it by duration to put the slow task on top.
The SQL / DataFrame tab
What it shows. One row per query, with its duration and the jobs it ran. A query’s page draws the physical plan as a graph. Blue boxes are whole-stage codegen stages with the total time tasks spent in them, and the number on each edge is the rows that flowed along it. With AQE on, the graph is the final plan, so it shows what Spark did after re-planning. Plan Details below it holds the same text as explain().
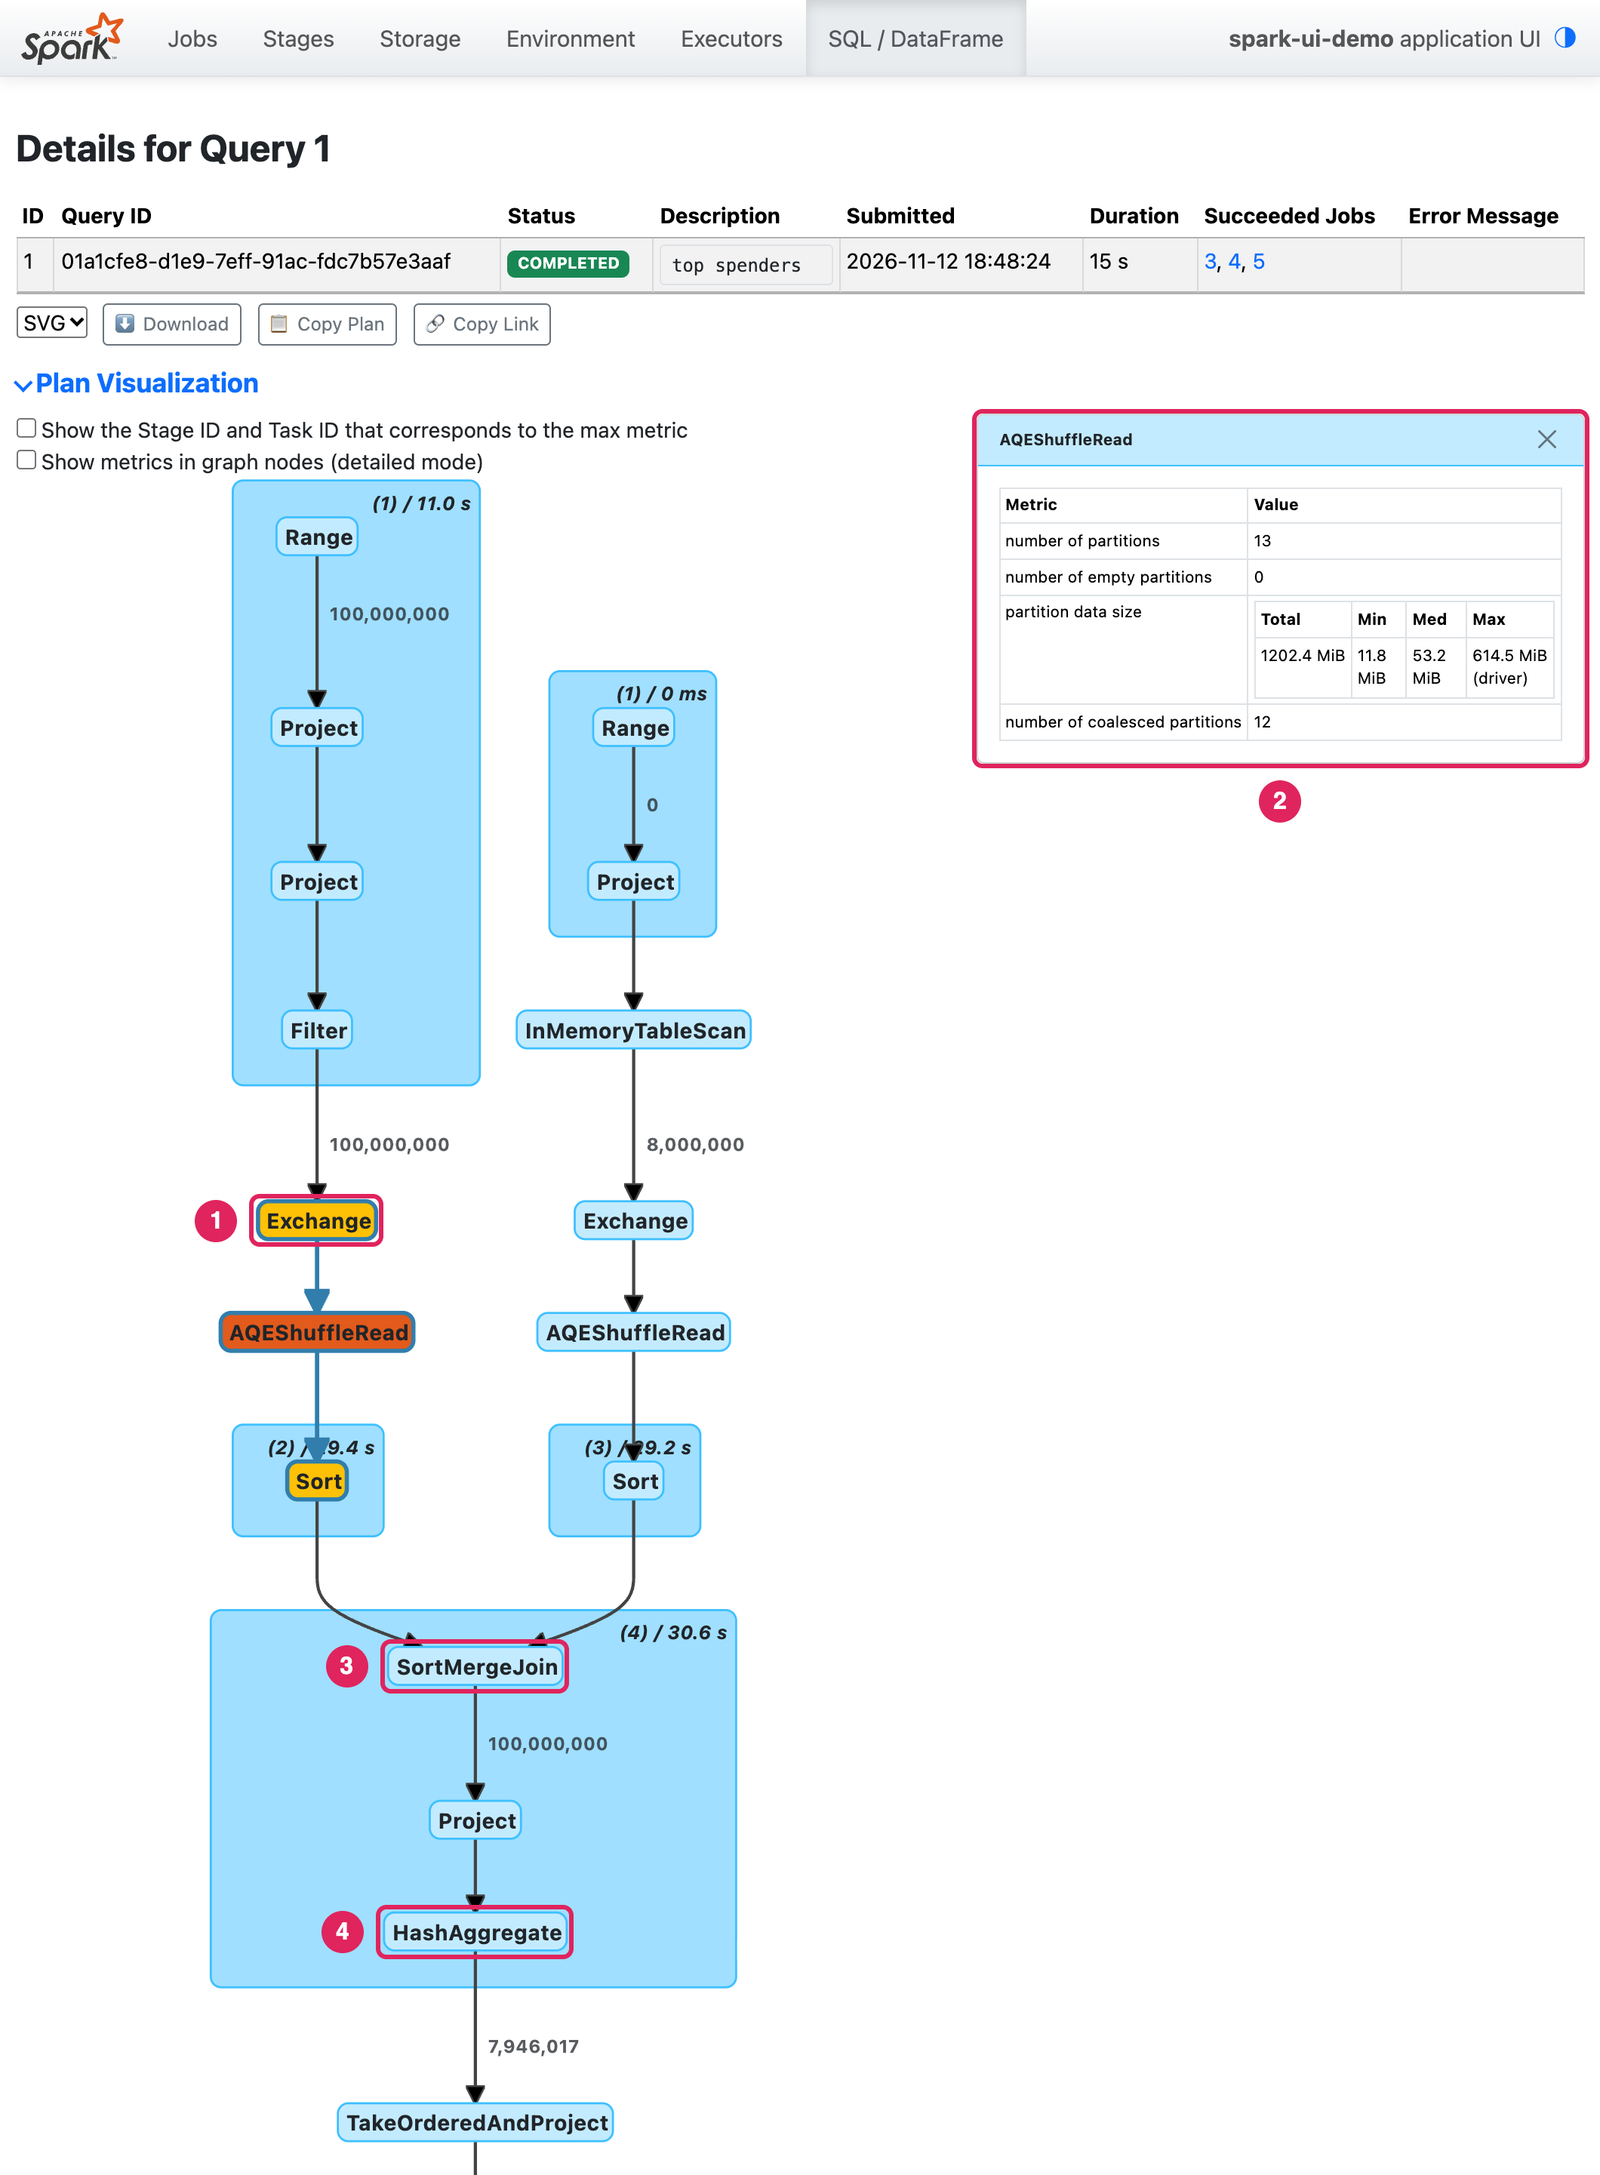
What to look for:
Exchangenodes. Each one is a shuffle, and the row count entering it is what gets moved. Here all 100,000,000 event rows are shuffled.- Operator metrics. In Spark 4.3, clicking an operator opens its metrics in a side panel. Older versions print them inside the node. The
AQEShuffleReadafter the exchange shows that AQE merged 200 shuffle partitions into 13 and that their sizes run from 11.8 MiB to 614.5 MiB with a median of 53.2 MiB. The skew is visible here before you open a single stage. - The join strategy. A
SortMergeJoinshuffles and sorts both sides. ABroadcastHashJoinavoids shuffling the large side. A sort-merge join against a small table is worth questioning. - Rows in against rows out. A join that emits far more rows than it received has duplicate keys on both sides. A filter that removes almost everything late in the plan belongs earlier.
- AQE’s marks.
AQEShuffleReadis labeled coalesced, local or skewed, and a join that AQE split for skew readsSortMergeJoin(skew=true). This plan has no skew mark.
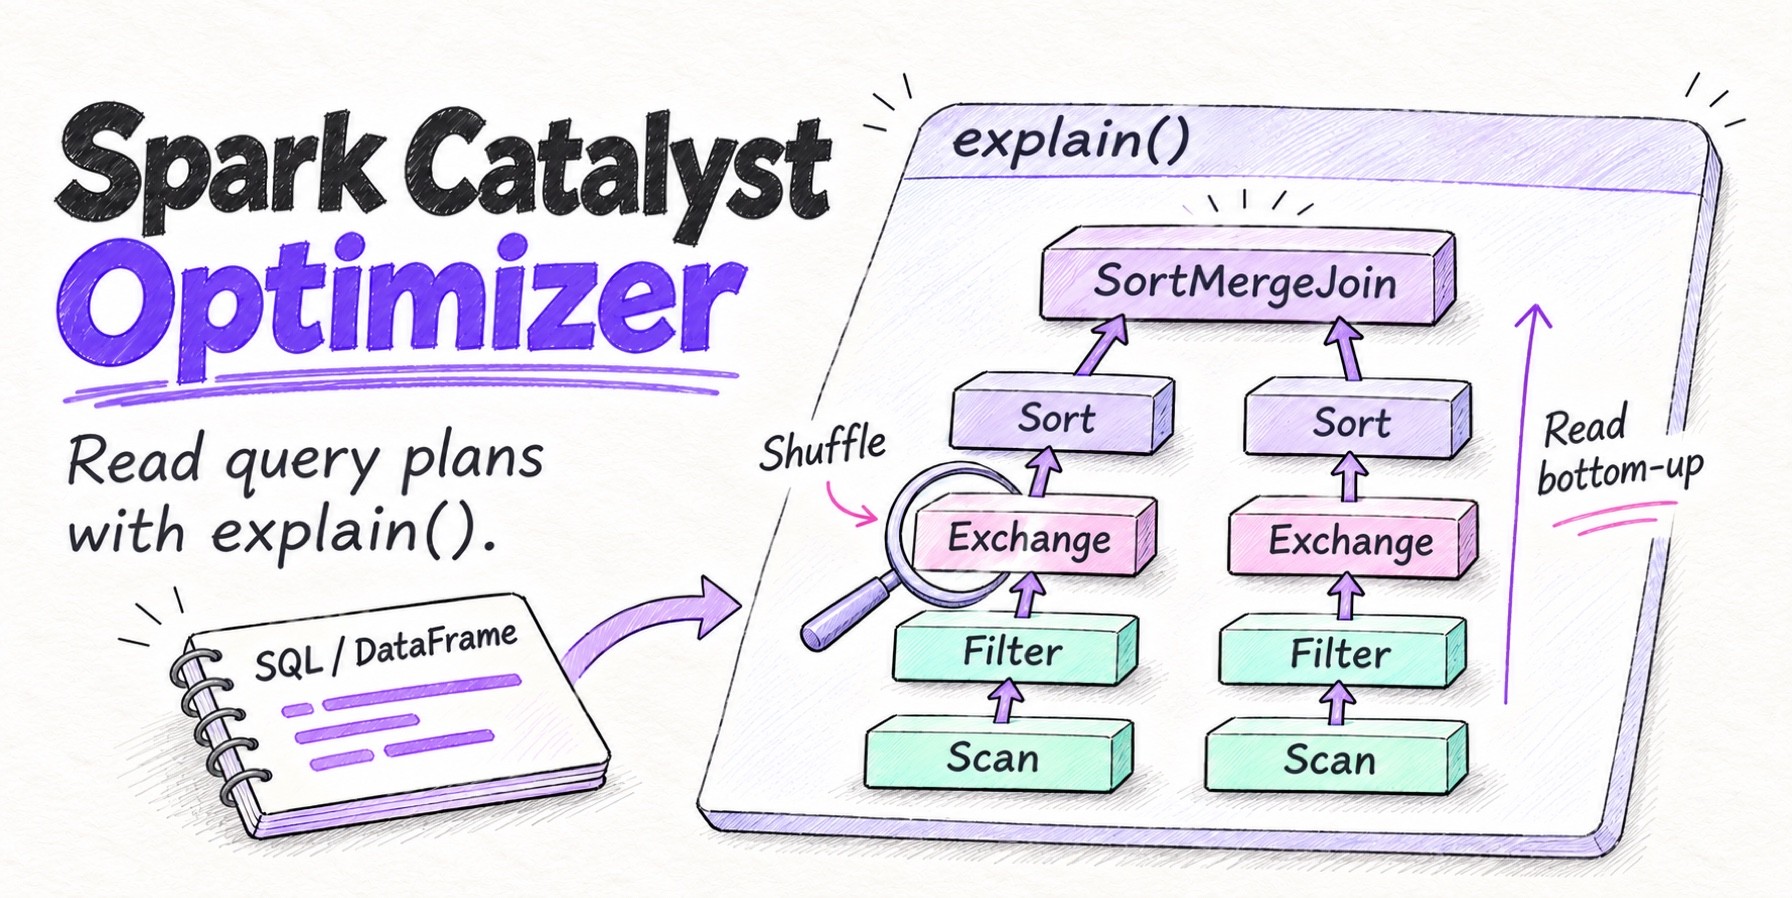
Our guide to the Catalyst optimizer and explain() explains how to read these plans operator by operator.
The Executors tab
What it shows. A summary row, then one row per executor and one for the driver: memory used for cached data, disk used, cores, task counts, total task time with GC time in brackets, input and shuffle totals, and links to each executor’s logs.
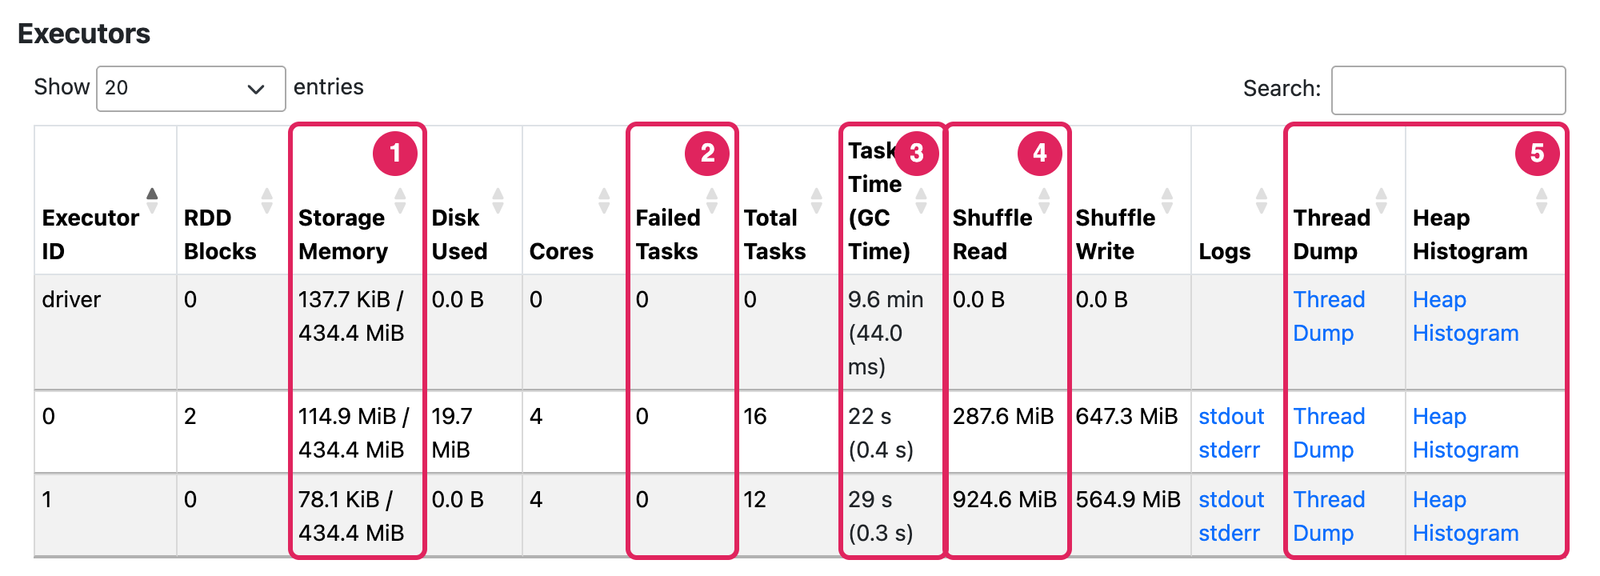
What to look for:
- GC time. Compare the bracketed GC time with the task time. Here it’s 0.4 s of 22 s and 0.3 s of 29 s, under 2%. The UI colors the cell red once GC passes 10% of task time, a sign of executors that are short of memory. Our executor memory guide covers sizing.
- Failed tasks piling up on one executor. That suggests a bad node. Failures spread evenly suggest the data or the code.
- Dead executors. The summary counts them, and Show Additional Metrics adds the reason each one was lost. Lost executors are behind most FetchFailedException errors.
- Uneven load. Executor 1 read 924.6 MiB of shuffle data against 287.6 MiB on executor 0, because it ran the oversized task.
- Storage memory and disk used. Executor 0 holds the cached users table.
Thread Dump and Heap Histogram exist only in the live UI. A thread dump shows what every thread on an executor is doing at that moment, which is the quickest way to see what a stuck task is waiting on.
The Storage and Environment tabs
Storage lists every cached DataFrame and RDD with its storage level, the number and fraction of partitions cached, and its size in memory and on disk.
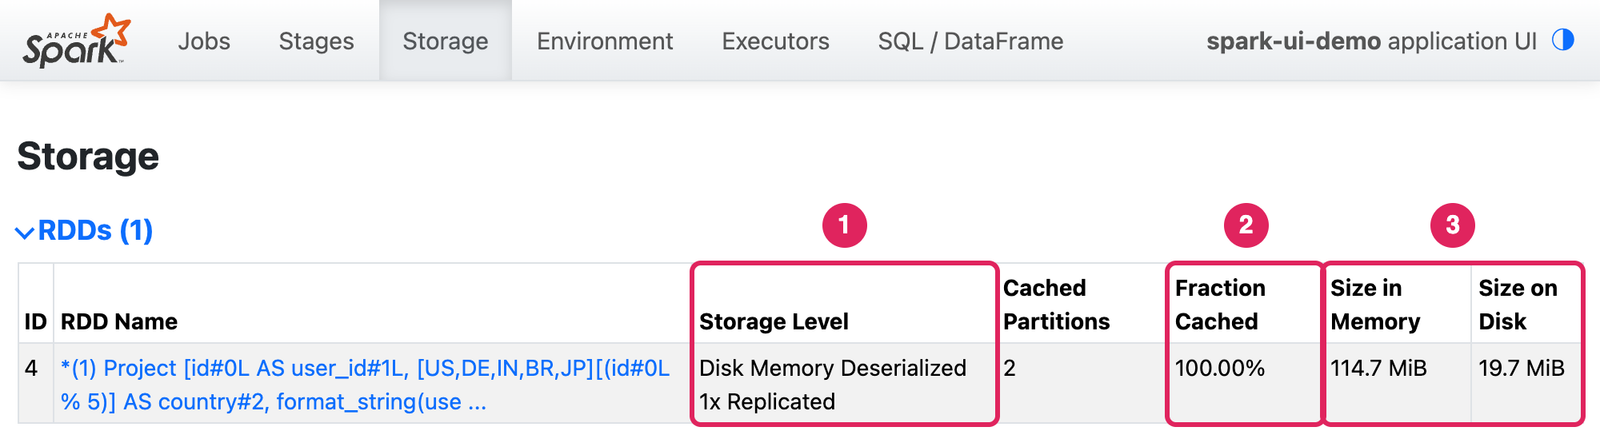
Look for a Fraction Cached below 100%, which means some partitions were never stored or have been evicted and will be recomputed when needed. Look for Size on Disk too. Disk Memory Deserialized is the default level for DataFrame.cache(), and it lets partitions that don’t fit in memory go to disk. Here one of the two partitions sits on disk (19.7 MiB serialized) and the other in memory (114.7 MiB), which the RDD’s detail page shows block by block. Reads from disk are slower. Look for caches nobody uses any more as well, because they hold memory that tasks could use. In the History Server this tab is usually empty.
Environment is where you confirm what the application actually ran with. Its sections cover runtime information (Java and Scala versions), Spark properties, resource profiles, Hadoop properties, system properties, metrics properties and classpath entries.
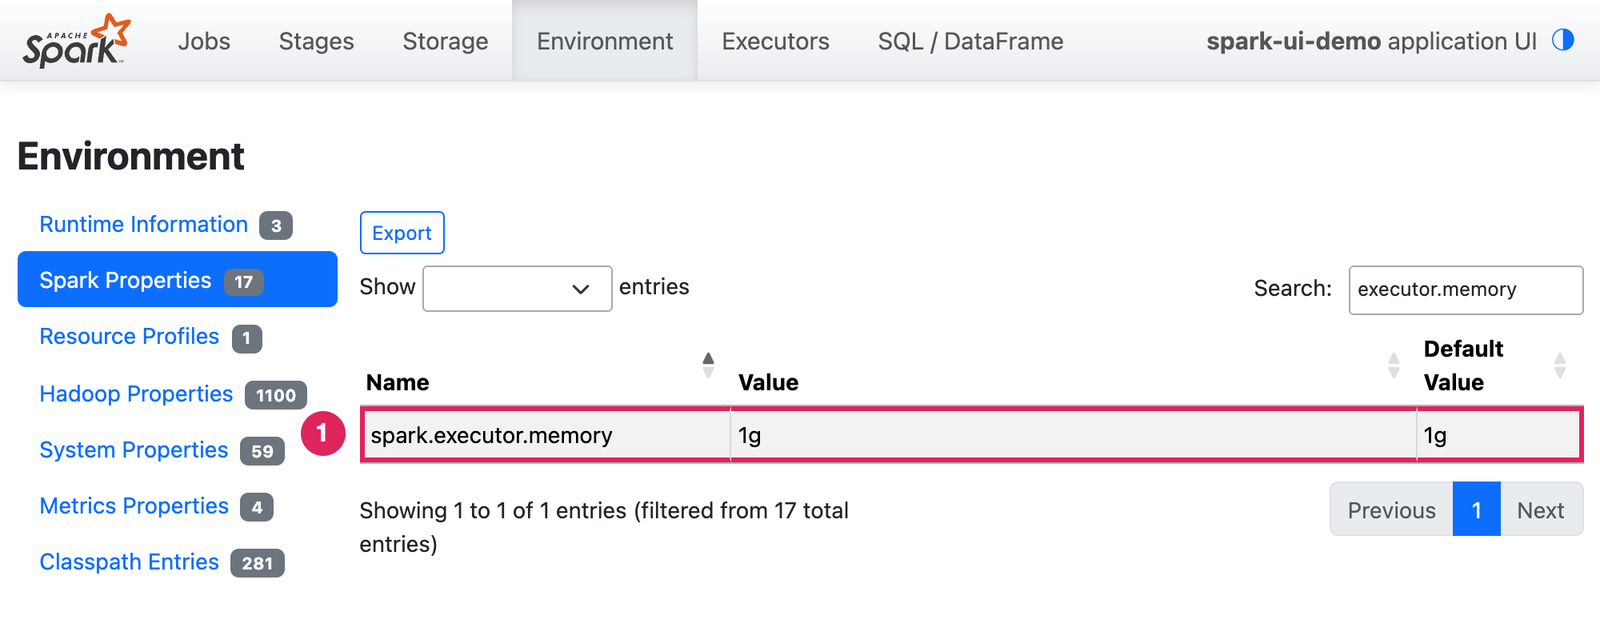
Use the search box to check a setting before you change it. A value you passed with --conf that isn’t listed never reached the application. The page reflects the configuration the application started with.
Applications that run Structured Streaming queries get one more tab, Structured Streaming, with input rate, processing rate and batch duration for each query.
A step-by-step diagnosis workflow
The tabs make most sense in a fixed order, from the widest view to the narrowest. This is the demo query, start to finish.
- Jobs tab: find the longest job. Job 5, “top spenders”, took 13 s. The query took 15 s in total.
- Stages tab: find its slowest stage. Job 5 ran one stage, stage 8, for 13 s. It read 1,212.2 MiB of shuffle data.
- Stage page: read Summary Metrics from median to max. Duration is 2 s against 13 s, and shuffle read is 4.3 million records against 60.2 million. One partition holds more than half of the stage’s rows. This is skew, and the 1.6 GiB spill on the same task is a consequence of it.
- SQL / DataFrame tab: find out why. Stage 8 belongs to query 1. The plan shuffles all 100 million events by
user_idfor aSortMergeJoin, and theAQEShuffleReadreports one 614.5 MiB partition against a 53.2 MiB median. AQE normally splits a skewed join partition larger than 256 MB, but only when the split doesn’t add another shuffle (spark.sql.adaptive.forceOptimizeSkewedJoinis off by default). Here the aggregation onuser_idreuses the join’s partitioning, so AQE left the partition alone. That is why the join carries no skew mark. - Executors tab: rule out the cluster. GC is under 2% of task time, no tasks failed and no executor died. The cluster is healthy. The problem is the shape of the data and the query.
The fix follows from step 4. The query joins 100 million rows and then reduces them to one row per user. Aggregating first lets Spark collapse user 1’s 60 million events into a handful of partial sums before anything is shuffled:
# Top spenders: aggregate per user first, then join
spend = events.groupBy("user_id").agg(F.sum("amount").alias("spend"))
(spend.join(users, "user_id").select("user_id", "email", "spend")
 .orderBy(F.desc("spend")).limit(10)
 .show(truncate=False))
We ran both versions and read the same pages again:
| Join, then aggregate | Aggregate, then join | |
|---|---|---|
| Query duration | 15.3 s | 5.5 s |
| Event rows shuffled | 100,000,000 | 29,744,160 |
| Shuffle written by the events stage | 1,129.7 MiB | 396.0 MiB |
| Largest shuffle partition | 614.5 MiB | 50.5 MiB |
| Join stage, median task | 1.8 s | 1.2 s |
| Join stage, slowest task | 12.9 s | 1.5 s |
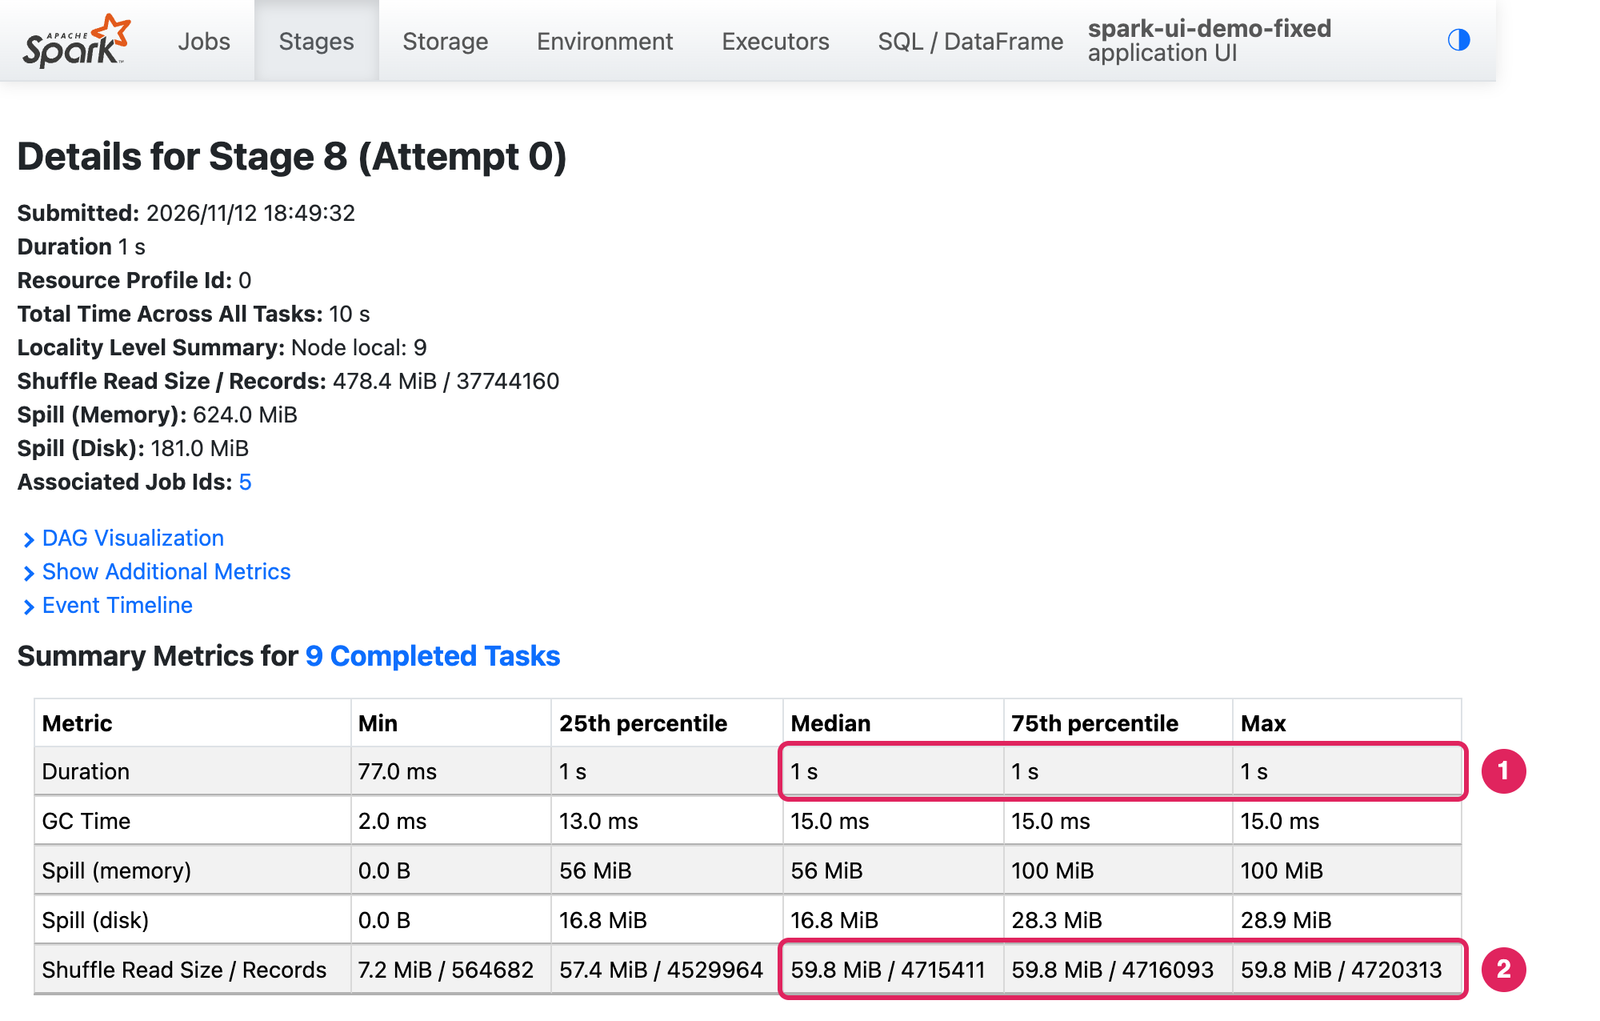
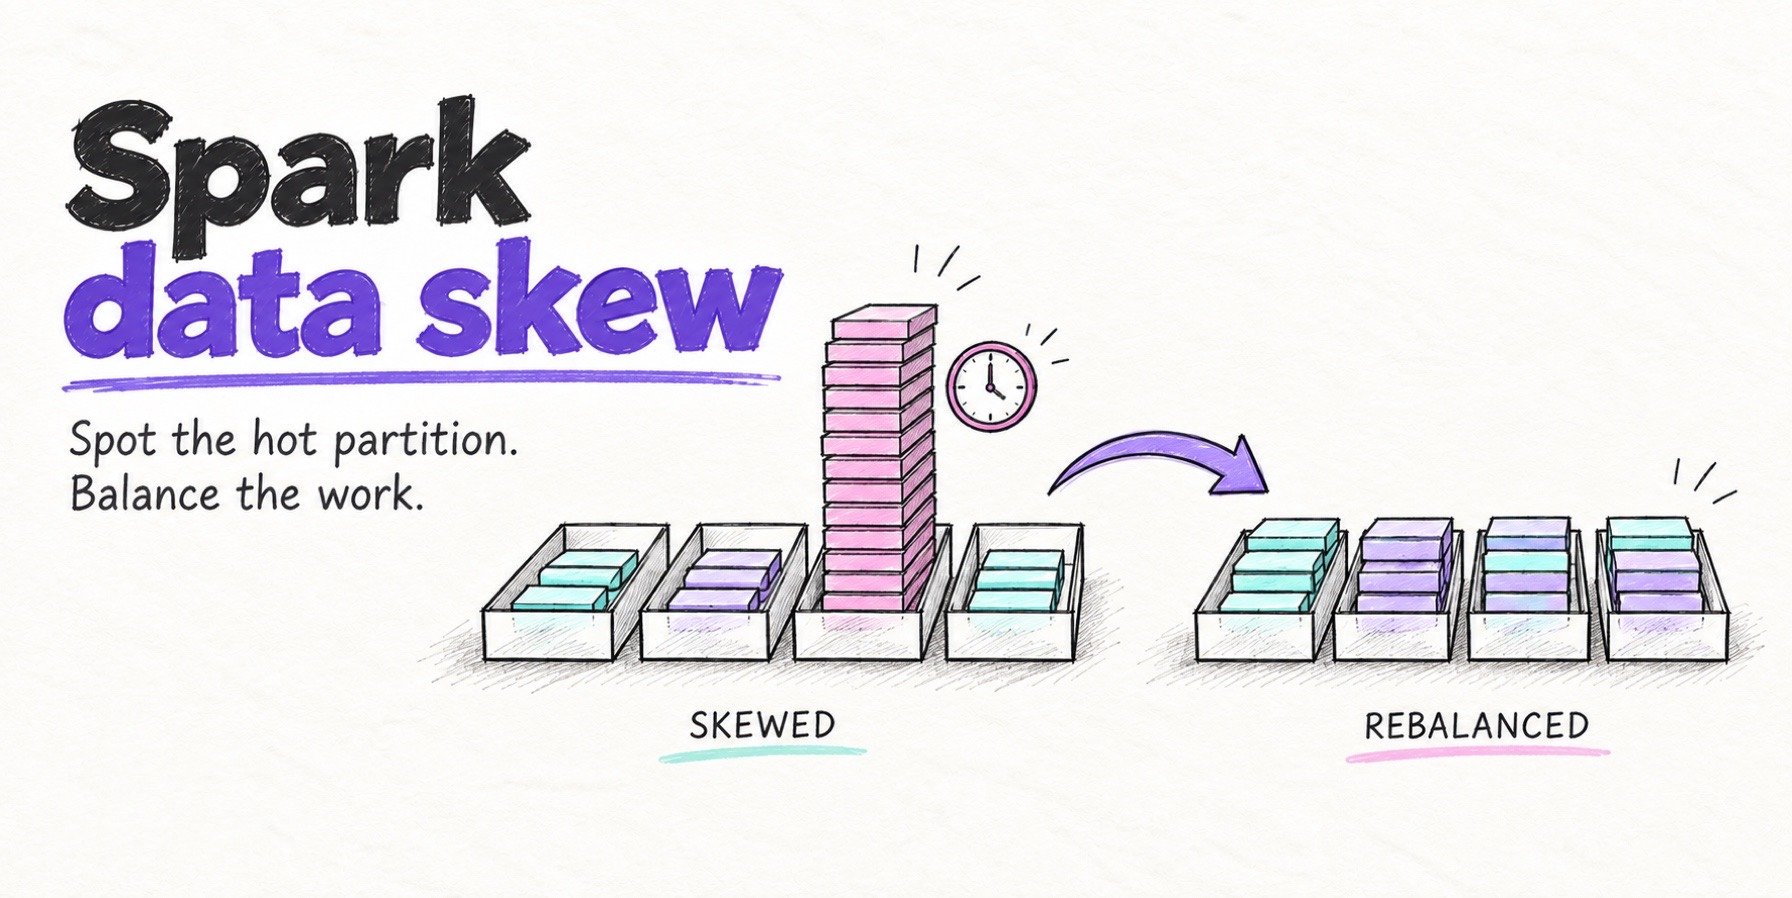
The fix has a cost. The events stage went from 2.1 s to 3.8 s, because it now aggregates before it shuffles and spills while doing so. The query still finishes almost 10 s sooner. When you can’t restructure a query this way, our data skew guide covers salting and AQE’s skew settings.
Common problems and their Spark UI signatures
| Problem | Where it shows in the Spark UI | Usual fix |
|---|---|---|
| Data skew | Stage page: max far above median for Duration and Shuffle Read Size / Records, and one long bar in the event timeline | Aggregate before joining, AQE skew join, salting (guide) |
| Spill | Stage page: Spill (memory) and Spill (disk) in the header and Summary Metrics | More memory per task, or more and smaller partitions (guide) |
| GC pressure | Executors tab: GC time above 10% of task time, shown in red. Stage page: GC Time row | Larger executors, fewer cores per executor, less caching |
| Heavy shuffle | Stages tab: large Shuffle Read and Shuffle Write. SQL tab: Exchange nodes with high row counts |
Filter and aggregate earlier, broadcast the small side (guide) |
| Small files | Stage page: thousands of tasks with a tiny Input Size each, and blue scheduler delay in the timeline | Compact the table, write fewer and larger files (guide) |
| Bad join strategy | SQL tab: SortMergeJoin against a small table, or BroadcastNestedLoopJoin on large inputs |
Fix statistics or add a broadcast hint (guide) |
| Out of memory, lost executors | Executors tab: dead executors and failed tasks. Stages tab: ExecutorLostFailure in the failure reason |
Size executor memory and overhead, reduce partition size (guide) |
| Fetch failures | Stages tab: a stage with retries and FetchFailedException in the failure reason |
Find why the executor holding the shuffle data died (guide) |
Limits of the Spark UI and going further
The Spark UI answers what one application did. It has four limits worth knowing:
- One application at a time. It can’t compare today’s run with yesterday’s. Our post on catching Spark performance regressions covers that.
- It ends with the driver. Without event logs and a History Server, a finished run leaves nothing to inspect.
- It forgets. By default it keeps the last 1,000 jobs, 1,000 stages and 1,000 SQL queries (
spark.ui.retainedJobs,spark.ui.retainedStages,spark.sql.ui.retainedExecutions), so long-running applications lose their early history. - It only sees Spark. A node that was reclaimed or a pod that was evicted shows up as a lost executor. The reason is in your cluster manager’s logs.
Everything in the UI is also available as JSON from the REST API under /api/v1, on the live UI and the History Server alike. This call returns the Summary Metrics behind the stage page:
$ curl -s 'http://localhost:4040/api/v1/applications/app-20261112184815-0000/stages/8/0/taskSummary?quantiles=0.5,1.0'
{
  "quantiles" : [ 0.5, 1.0 ],
  "duration" : [ 1794.0, 12922.0 ],
  ...
  "memoryBytesSpilled" : [ 1.97131728E8, 1.769989536E9 ],
  ...
  "shuffleReadMetrics" : {
    "readRecords" : [ 4319556.0, 6.0237558E7 ],
For dashboards and alerts, the driver exposes executor metrics in Prometheus format at /metrics/executors/prometheus, on by default, and Spark’s metrics system can send driver and executor metrics to sinks such as Prometheus, Graphite and StatsD. For a video walkthrough of the same signals, see the Onehouse Deep Dive session Read the Spark UI Like a Profiler.
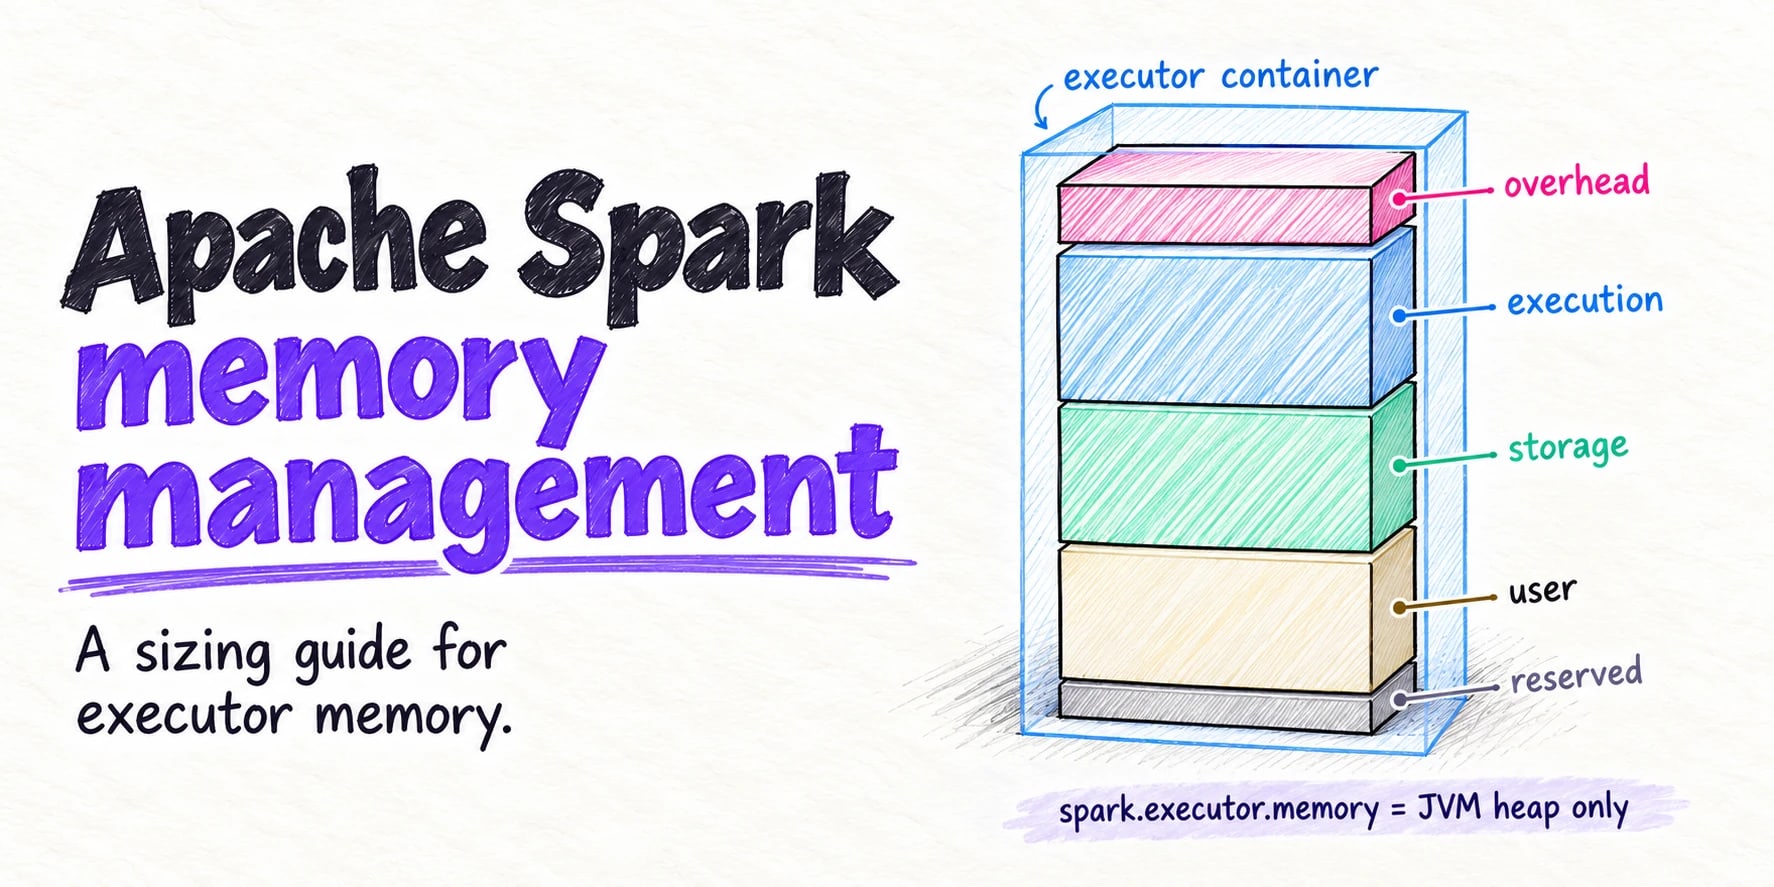
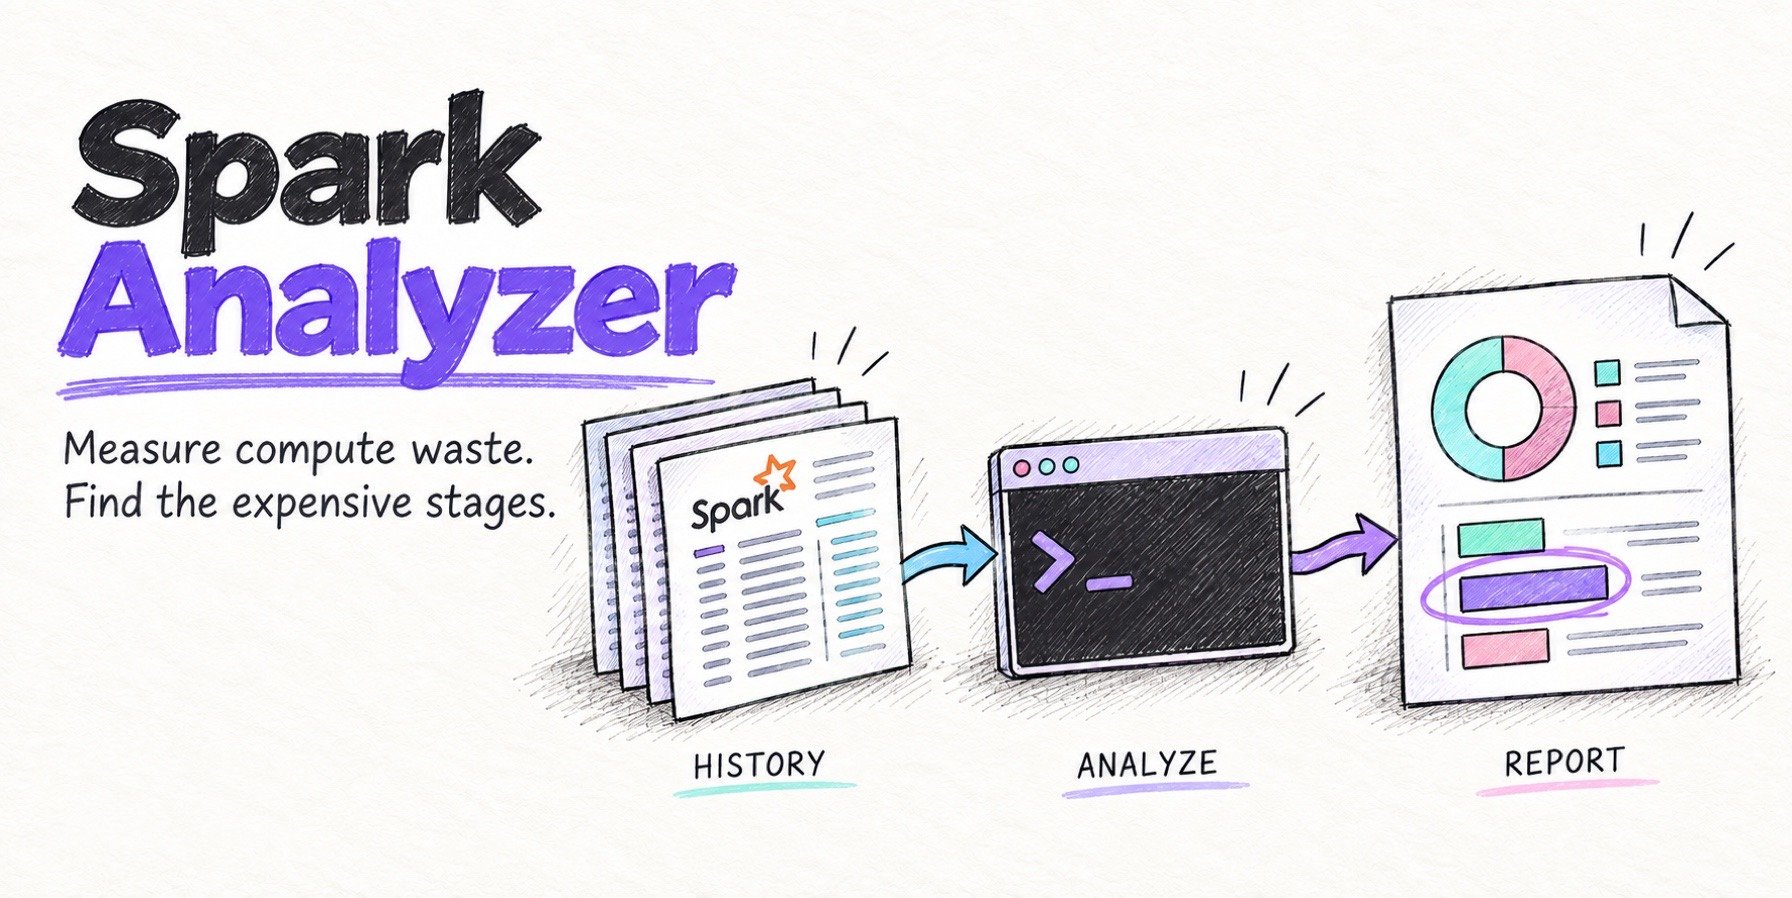
Two free Onehouse tools pick up where the Spark UI stops. Spark Analyzer is a command-line tool that reads the History Server API and reports wasted executor time across many applications. The AI Spark Engineer runs inside the Spark UI of jobs submitted through the Quanton Operator, whether they run on open-source Spark or on Quanton, the Spark engine from Onehouse available on its own at quanton.dev. It watches skew, spill, GC pressure and shuffle metrics while a job runs and answers questions about them using your own LLM API key. Quanton can be used without the Onehouse platform, and you can create an account to try it.
FAQs
What is the Spark UI?
The Spark UI is the web interface built into every Spark application. The driver serves it while the application runs, and it shows the application’s jobs, stages, tasks, SQL query plans, executors, cached data and configuration. Engineers use it to monitor running jobs and to work out why a job is slow or failed.
What port does the Spark UI run on?
Port 4040 on the driver by default. If 4040 is in use, Spark tries 4041, 4042 and so on, and logs the port it chose. You can set a specific port with spark.ui.port. The Spark History Server, which shows finished applications, uses port 18080.
How do I open the Spark UI after a job has finished?
Use the Spark History Server. The live UI stops when the driver exits, so the job must have written event logs (spark.eventLog.enabled=true and a durable spark.eventLog.dir). A History Server reading that directory rebuilds the same tabs for the finished run.
What does a skipped stage mean in the Spark UI?
A skipped stage didn’t need to run because its output already existed, usually as shuffle files written by an earlier job or as cached data. It isn’t an error, and it took no time.