Talk with our engineers by joining the new Onehouse community Slack!
Ecosystem and integrations
Observability
Onehouse ships Prometheus and pre-built Grafana dashboards inside your data plane, and can also push metrics and Spark logs straight to the monitoring tools you already run.
Prometheus and Grafana are served from the project’s load balancer, which is internal by default: reach it over VPN, a bastion host, or kubectl port-forward. A project admin can enable data plane access, which exposes Grafana and the Spark UIs to authenticated Onehouse users and keeps Prometheus internal.
Metrics and Spark logs can be exported to these destinations:
| Destination | What | Credential |
|---|---|---|
| Datadog, Grafana Cloud, Honeycomb | Metrics | Secret |
| Splunk Enterprise | Logs | HEC token |
| S3, Azure Blob Storage | Logs | Workload identity, no secret |
Metrics and logs travel on independent pipelines: an OpenTelemetry Collector for metrics, and Fluent Bit with a Vector gateway for logs. A log-volume spike or a vendor outage on one path cannot delay the other. Telemetry goes from your environment directly to your vendor and is not routed through Onehouse.
The console adds per-resource monitoring for Flows, tables, table services, jobs, SQL, and clusters, with charts for sync duration and pending data. Kubernetes control-plane audit logs archive to your own bucket, and application-level user activity is recorded in a separate audit log.
For agents, the AI Gateway records traces, inference activity, latency, and estimated spend by caller and model as open tables in your storage.
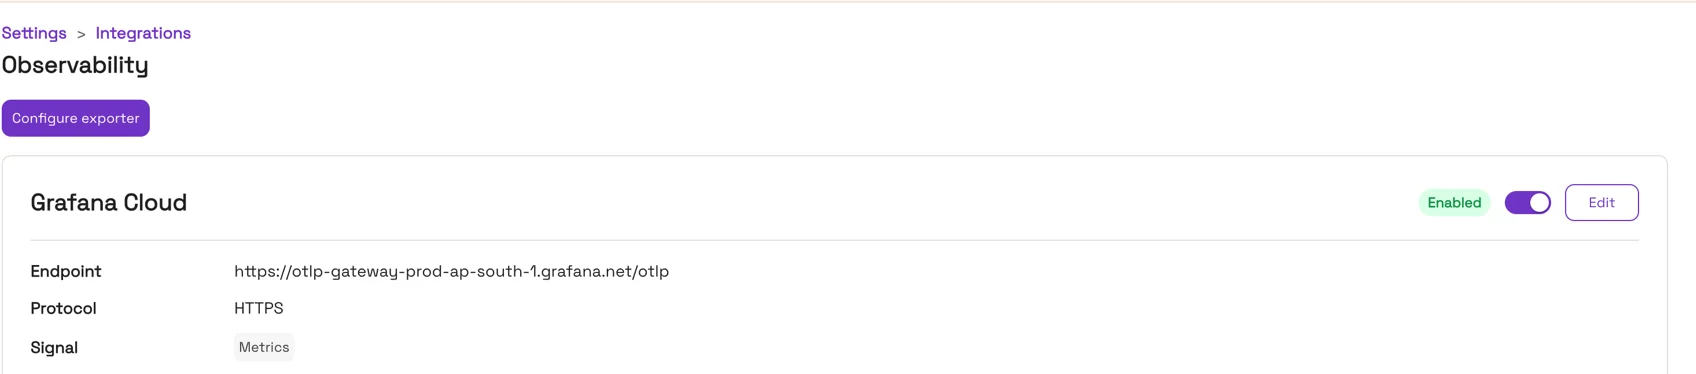
A configured metrics exporter to Grafana Cloud.
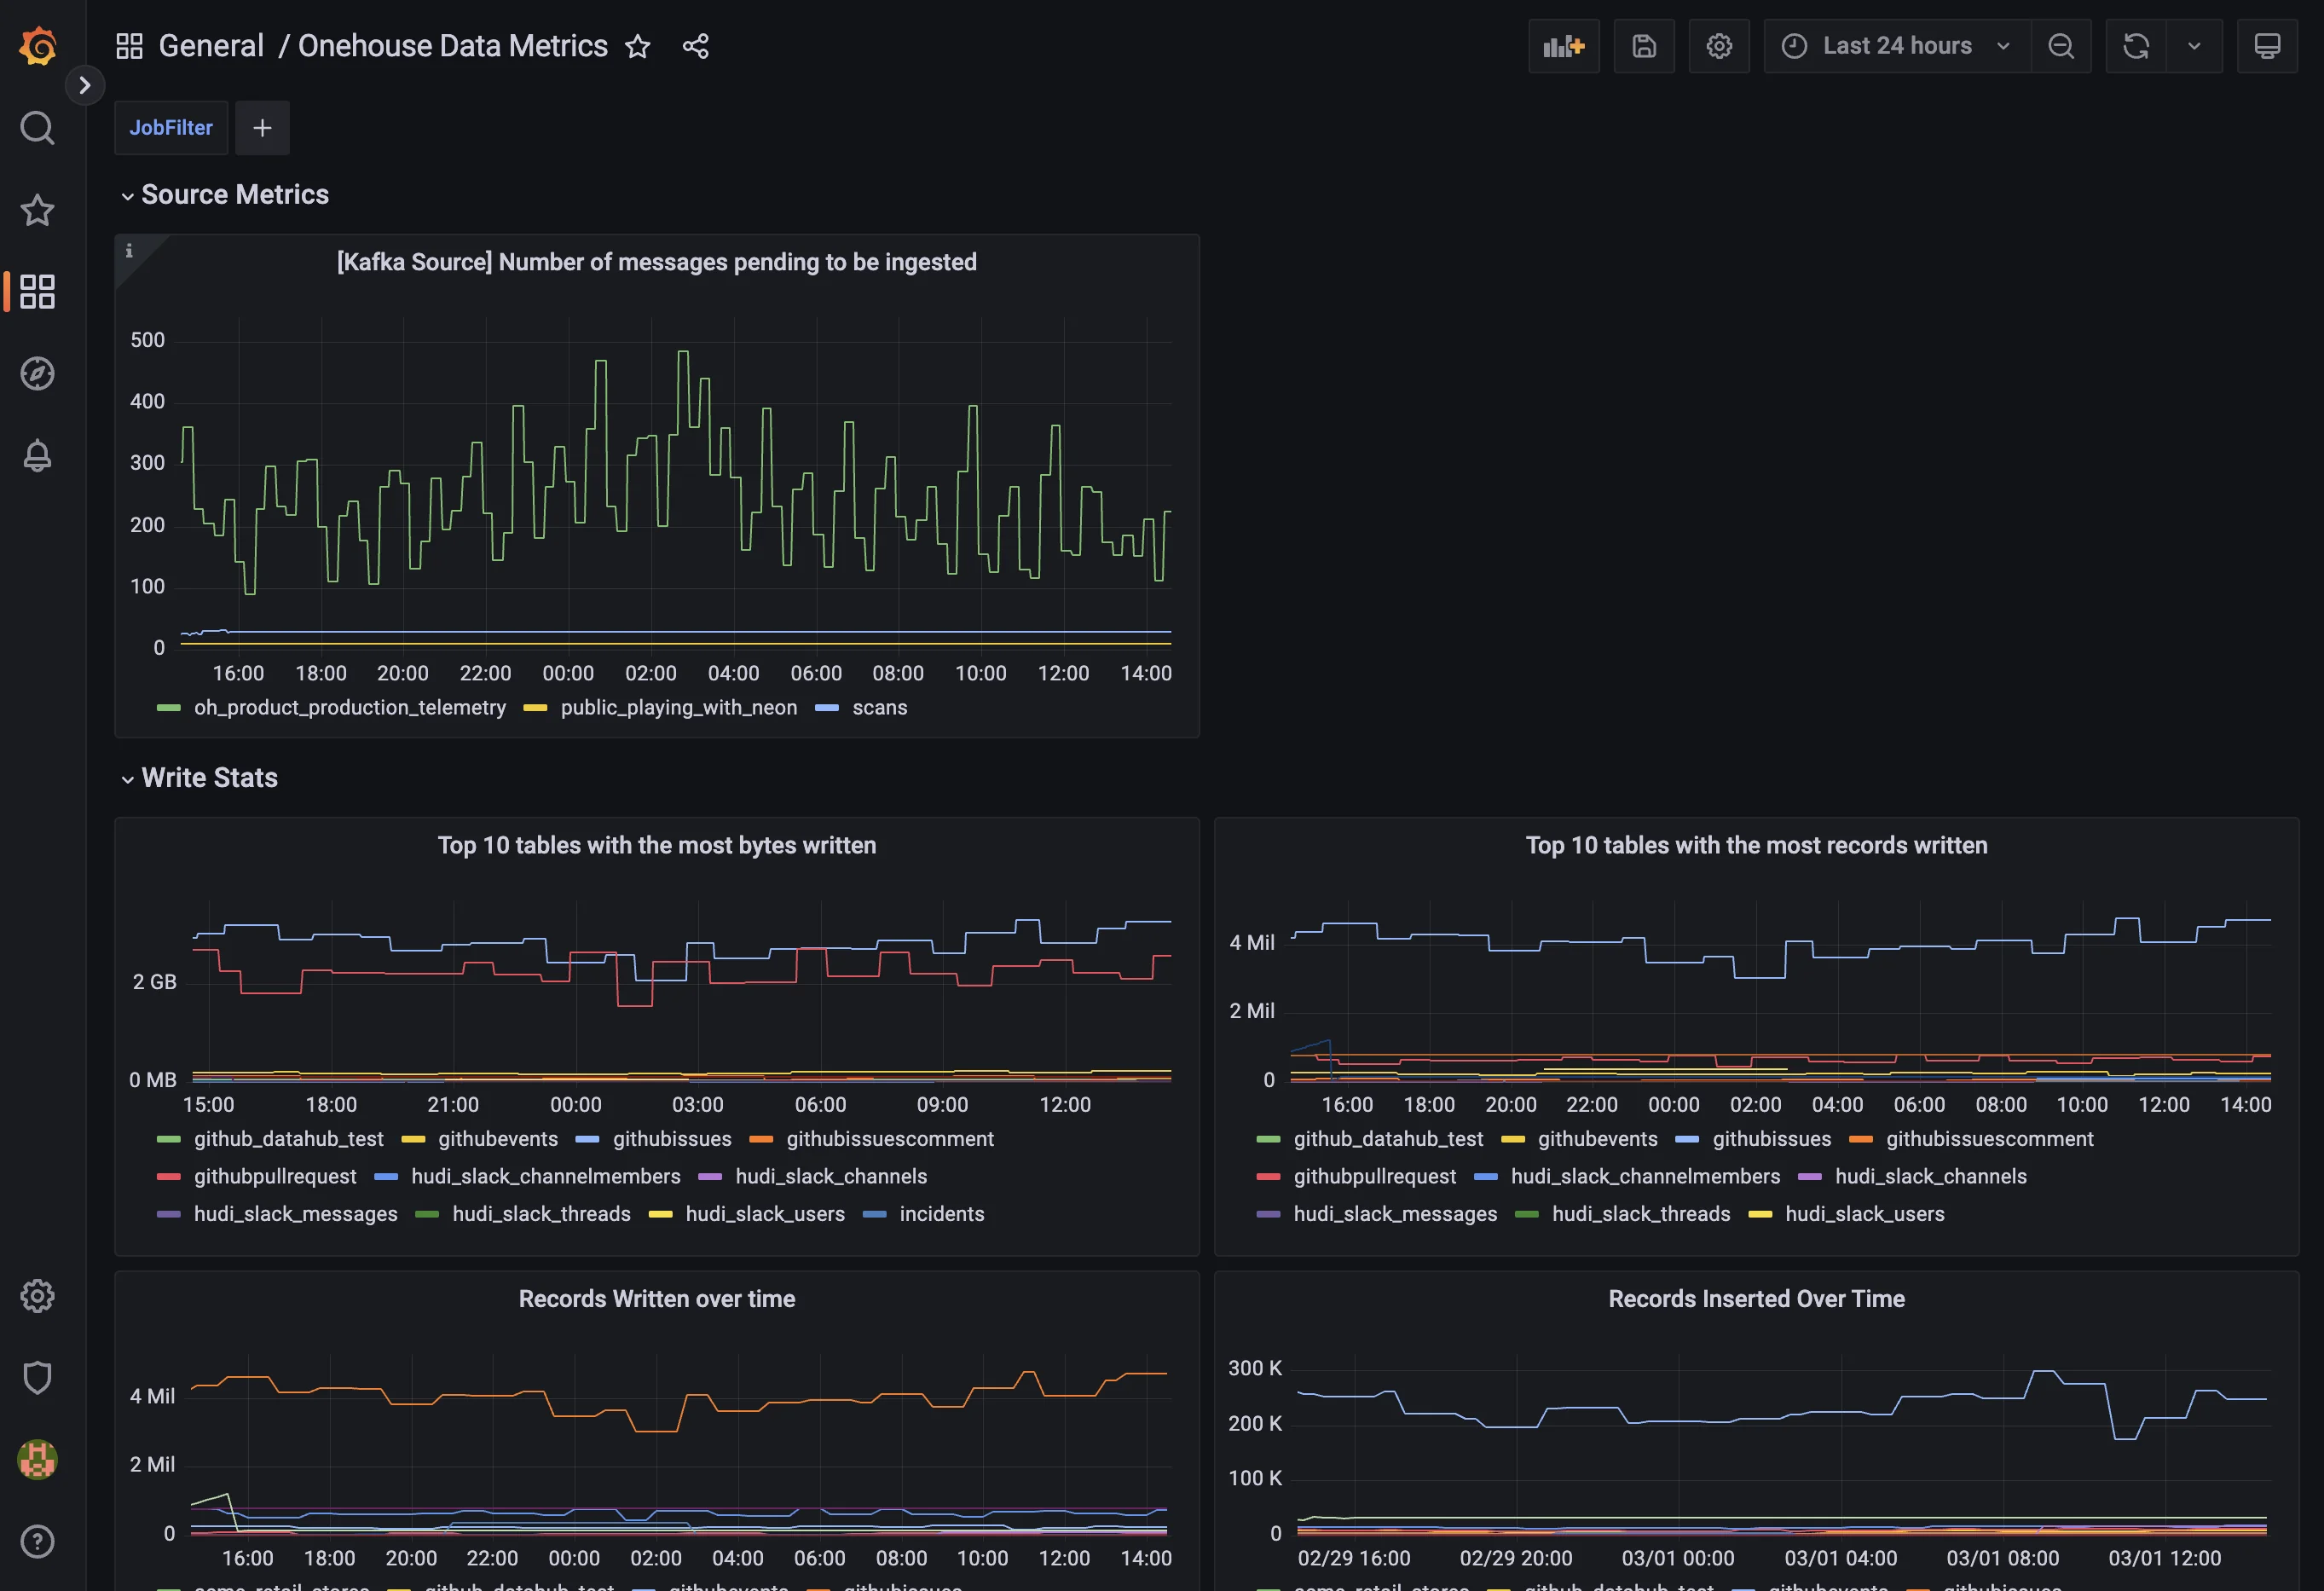
The Grafana dashboards that ship in the data plane: source lag, write volume by table, and records over time.