Meet Cost Analyzer – a free tool to unearth Apache Spark™ bottlenecks

TL;DR :
A simple python tool to analyze your spark logs - identifying bottlenecks and resource wastage in your DAGs. Cost Analyzer for Apache Spark™ works across all major Spark platforms and deployments – AWS EMR, GCP Dataproc, Microsoft Fabric, Databricks and more. It runs locally on your computer and even gives you tips on how to accelerate your jobs.
And start measuring your Spark performance today!
Introduction
With global data volumes ever increasing, the need for efficient distributed data processing frameworks has become abundantly clear to the industry. Started in 2009, the Apache Spark™ project was created to help solve many of these pressing needs - as a worthy successor to Apache Hadoop MapReduce and Apache Hive. In the years since, it’s become the lingua franca for data processing pipelines.
A tremendous amount of money is spent globally each year processing Spark jobs. But, is it well-spent? That’s a question that comes up with almost every data lakehouse user we talk to at Onehouse. If you don’t want to be reading through hundreds of DAG visualizations and thousands of stage logs just to find a single bottleneck in your Spark job, this blog is for you. Our free Cost Analyzer for Apache Spark™ tool simplifies Spark log analysis, pinpointing performance bottlenecks, resource waste, and predicting future cost/performance. All from your local machine via a single command line interface. The blog covers how we built it, the tool’s capabilities and how you can get started easily.
Spark is ubiquitous
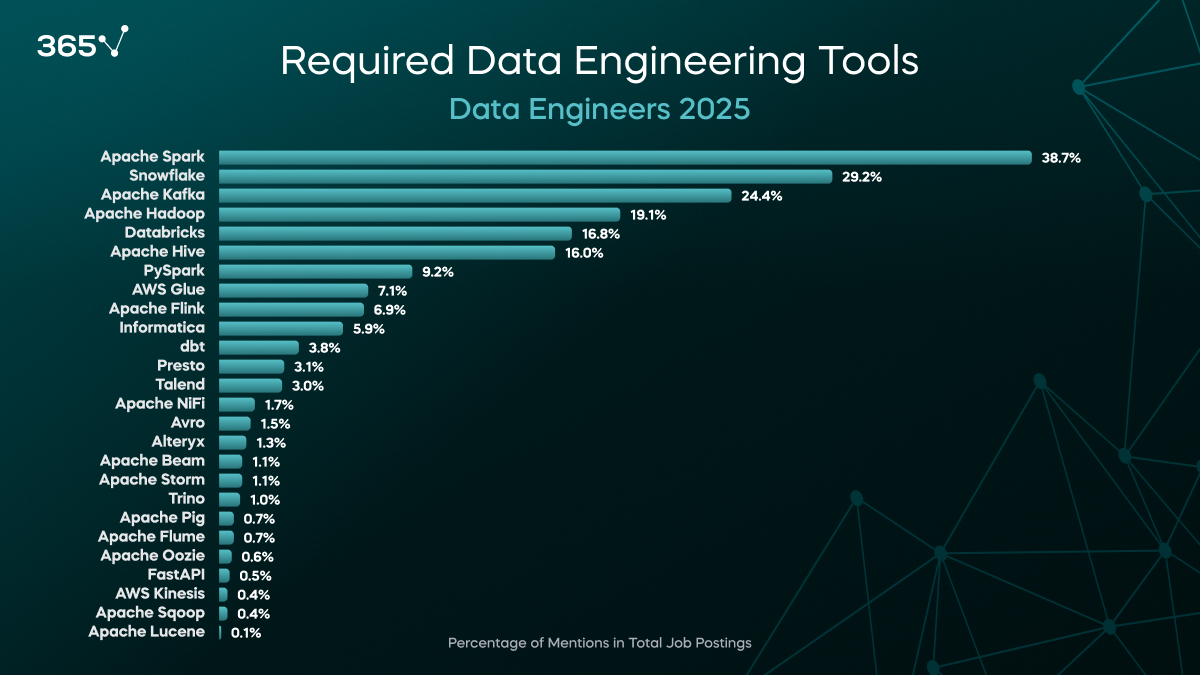
Nearly every major data platform vendor has a Spark-related offering - from the cloud hyperscalers with Amazon EMR/Glue, Google Dataproc, to Microsoft Fabric, to ISVs such as Databricks and most recently, even Snowflake . Here at Onehouse, we also support Spark with our own engine, Quanton, which is purpose-built to offer the best cost/performance for data lakehouse workloads. With such a large presence in data engineering, there can be no doubt that 10s of billions of dollars are being spent on Spark jobs every year. Just Databricks, recently reported a revenue run rate of $3.7B, with a good portion of it driven by Spark compute spend. In fact, amongst job postings for data engineers, Spark is the 3rd most sought-after skill by employers, only behind the base programming languages - SQL and Python.
With so much money being spent on Spark, you want to make sure that you don’t have runaway Spark compute costs that go undetected. Spark workloads, spanning Java/Scala, Python, and SQL, present an optimization challenge for data engineers due to their varied APIs and interaction with different lakehouse open table formats. Jobs auto-scale up and down, often contain hundreds or thousands of stages and can hide the root cause of slowness within them. This complexity makes bottleneck identification and job tuning difficult, in general. We’ve designed this spark-analyzer to be helpful to data engineers with deep Spark expertise looking to identify areas to improve data latency and engineering managers interested in reducing the bottom line of their compute spend alike.
Why Spark Analysis Is Hard?
Despite Apache Spark’s widespread adoption as the de facto standard for large-scale data processing, most Spark applications run significantly below their potential. From analyzing thousands of production Spark applications through our tooling, we consistently observe that organizations waste substantial portions of their Spark compute budget due to suboptimal configurations, inefficient code patterns, and a lack of visibility into actual performance bottlenecks. Yet unlike traditional databases with decades of mature tooling, Spark analysis remains surprisingly difficult–leaving even experienced data engineers sometimes flying blind when it comes to optimization.
The Performance Gap: Your Spark Jobs Are Likely Underperforming
Here's an uncomfortable truth: most Spark applications run sub-optimally, wasting compute resources and developer time. In our analysis of hundreds of production Spark workloads across different industries, we consistently see compute waste ranging from 30-70%. This isn't due to lazy engineering, it's a systemic challenge that stems from Spark's complexity and the gap between its theoretical potential and real-world implementation.
Let's say that you’re running a Spark job that takes 10 executors, each with 32 cores (scale that is more common than not for our customers). The 30-70% compute wastage we typically observe means that you are wasting somewhere between 96 and 224 cores, or 3 to 7 instances for the entire duration of the job. Multiply this across the job duration, for each run of the job, and the hundreds or thousands of Spark jobs that many organizations operate, the waste balloons into millions of dollars.
The challenge is compounded by Spark's operational complexity. While it provides incredible flexibility for diverse workloads, this flexibility comes with a significant tuning burden. Production Spark applications often require manual optimization across dozens of parameters: executor counts, memory allocation, partitioning strategies, shuffle configurations, and more. Each workload's optimal configuration depends on factors like data size, cluster resources, and access patterns, making systematic optimization a complex, time-intensive process.
The Visibility Problem: Flying Blind at Each Stage
Traditional monitoring tools give you application-level metrics, job duration, overall resource usage, success/failure status, but they miss the critical details where optimization opportunities actually live. The real performance bottlenecks happen at the stage level, buried within the execution plan where most monitoring tools fear to tread.
Without stage-level insights, data engineers are essentially debugging performance issues with one hand tied behind their back. You might see that a job is slow, but you can't easily answer fundamental questions like:
- Which specific stages are consuming the most resources?
- Are your extract operations efficiently reading data, or are they scanning unnecessary partitions?
- Is that expensive join actually utilizing broadcast optimization, or is it falling back to expensive shuffle operations?
- How much of your allocated compute time is spent on actual data processing versus waiting for I/O or network transfers?
This visibility gap means that even experienced Spark developers often resort to trial-and-error optimization, tweaking configuration parameters and hoping for improvement, rather than making data-driven decisions based on actual execution patterns. When they see some improvement to acceptable levels, they often stop pursuing the fully optimal setup due to sheer complexity.
Missed Optimization Opportunity: Understanding Workload Patterns
Every Spark application has a unique fingerprint of operations. Some are extract-heavy (lots of data scanning), others are transform-intensive (complex aggregations and joins), while others focus primarily on loading data efficiently. Understanding these workload patterns is key to optimization, but most organizations lack the tools to classify and analyze their Spark operations systematically.
Without this understanding, optimization efforts are scattered and ineffective. Teams might spend weeks optimizing join performance when their bottleneck is actually in data extraction, or they might add more executors when the real issue is memory allocation. It's like trying to optimize a car's performance without knowing whether you're driving on city streets or highways.
The pattern recognition challenge becomes even more complex when you factor in the variety of storage formats (Apache Parquet, Delta Lake, Apache Hudi, Apache Iceberg) and the different optimization strategies each requires. A performance tuning approach that works brilliantly for Hudi upserts might be counterproductive for Iceberg merge operations.
This is where systematic analysis becomes crucial—but until now, building this level of insight required significant engineering investment that most teams simply couldn't justify, leaving them stuck with suboptimal performance and spiraling cloud costs.
What is Cost Analyzer for Apache Spark™
The challenges we outlined aren’t new. Data Engineers have been grappling with Spark optimization for years. Yet surprisingly, there has been a glaring gap in tooling specifically designed to understand and analyze Spark job performance at the level of detail where optimization actually occurs.
Think about it: we have sophisticated APM tools for web applications that can trace every database query and API call. For Spark, while profilers and monitoring tools certainly exist, there’s a significant gap between having detailed execution data and efficiently extracting systematic optimization insights from it. Most teams struggle to translate the wealth of available Spark execution data into actionable optimization strategies across their entire application portfolio.
The existing tooling landscape falls short in crucial ways:
We looked at several tools out there, released at various points (1) Dr-elephant released April 2016 2) Datadog Spark Monitoring release May 2016 3) Spark Measure released July 2017, 4) Groupon Sparklint released 2016 but archived April 2025) and found that while they provide valuable operational insights, they fall short in crucial ways for systematic performance optimization. They treat Spark applications as black boxes, showing you when jobs start and finish, how much memory they consumed, and whether they succeeded or failed. But they don't answer the fundamental questions: What type of work was actually being performed? Which stages were bottlenecks? How efficiently were resources being utilized during different phases of execution?
Spark UI itself also provides valuable insights, but it's designed primarily for real-time debugging during development, not for systematic analysis of production workload patterns. While it excels at task-level detail, it lacks the aggregation and pattern recognition capabilities needed to analyze workload trends across multiple applications. You can drill into individual task details, but extracting patterns across hundreds of stages and multiple applications requires significant manual effort.
What's been missing is a tool that can:
- Automatically classify Spark operations into meaningful categories (extract, transform, load) to understand workload composition
- Analyze stage-level performance patterns to identify where compute resources are actually being spent versus wasted
- Recognize storage format usage (Hudi, Delta, Iceberg, Parquet) since optimization strategies vary dramatically between them
- Calculate actual resource utilization beyond simple “job completed in X minutes" metrics
- Provide actionable insights rather than just more dashboards to monitor
The data engineering community needs a tool that could take the overwhelming detail of Spark's execution engine and transform it into clear, actionable intelligence about where performance improvements could be found. Spark Analyzer is built by engineers who've spent years optimizing planet-scale Spark workloads at companies like Uber or Linkedin and understand exactly what information is needed to make smart performance decisions.
Rather than forcing you to become a Spark tuning expert, Spark Analyzer does the heavy lifting of pattern recognition and performance analysis, then presents findings in a way that makes optimization opportunities immediately clear. It's the difference between having data about your Spark jobs and having insight into how to make them better.
How To Get Started
Getting Started: From Installation to First Analysis in Minutes
One of our core design principles was making Spark analysis accessible to any data engineer, regardless of their infrastructure setup or security requirements. Getting started with Spark Analyzer is intentionally straightforward with no complex deployments, no infrastructure changes, and no lengthy onboarding process.
Installation: Simple pip install
We believe powerful tools shouldn't require complex setup procedures. Getting Spark Analyzer running is as simple as any other Python tool in your data engineering toolkit:
# Install the package
pip install spark-analyzer
That's it. No cluster deployments, no additional services to manage, no complex configuration files to maintain. The tool runs locally on your machine and connects to your existing Spark infrastructure without requiring any modifications to your current setup.
Configuration: Point to Your Spark History Server
Spark Analyzer works by connecting to your existing Spark History Server, the same interface your team already uses to debug Spark applications. The initial configuration is handled through an interactive wizard that walks you through the setup:
# Run the configuration wizard
spark-analyzer configureThe wizard automatically detects your environment and guides you through the connection setup. Whether you're running Spark on EMR, Databricks, or any other platform, the tool adapts to your specific infrastructure. It leverages the standard Spark History Server API, which means it works with virtually any Spark deployment without requiring special permissions or infrastructure changes.
Privacy Options and Analysis Modes
We recognize that data governance and privacy are critical concerns when analyzing production workloads. Spark Analyzer offers flexible privacy controls and analysis modes to meet different organizational requirements:
Local Mode: Perfect for organizations with strict data governance policies or air-gapped environments. In local mode, all analysis happens entirely on your local machine. No data leaves your environment. The tool connects to your Spark History Server, performs the analysis locally, and generates reports that you can review and share as needed.
  # Complete local analysis - no data uploaded anywhere
  spark-analyzer analyze --save-local
Enhanced Mode with Onehouse: For teams who want deeper acceleration insights and cost projections, the enhanced mode securely uploads anonymized analysis data to Onehouse's optimization engine. This enables advanced features like:
- Detailed acceleration projections based on your specific workload patterns
- Comparative benchmarking against similar workloads
- Custom optimization recommendations tailored to your storage formats and access patterns
Privacy-First Design: Regardless of which mode you choose, Spark Analyzer includes built-in privacy controls:
# Hash sensitive information like stage names and descriptions
spark-analyzer analyze --opt-out name,description,details
The --opt-out option automatically hashes any potentially sensitive information (stage names, details, descriptions) while preserving the analytical value of the performance data. Your performance patterns and resource utilization metrics are preserved, but any business-specific identifiers are protected.
First Analysis:
Once configured, running your first analysis is a single command:
 # Analyze your Spark applications
 spark-analyzer analyze
The tool automatically discovers available applications in your Spark History Server, guides you through selecting which applications to analyze, and generates comprehensive reports within minutes. Whether you're analyzing a single application or running regular performance assessments across your entire Spark workload, the workflow remains consistent and straightforward.
Spark Analyzer Reports
Included in the Analyzer output is a detailed report for each of your Spark Applications with the following results:
- Performance/Runtime Insights
- Stage-level activity insights (with classification of workload type)
- Quanton Engine Speedups
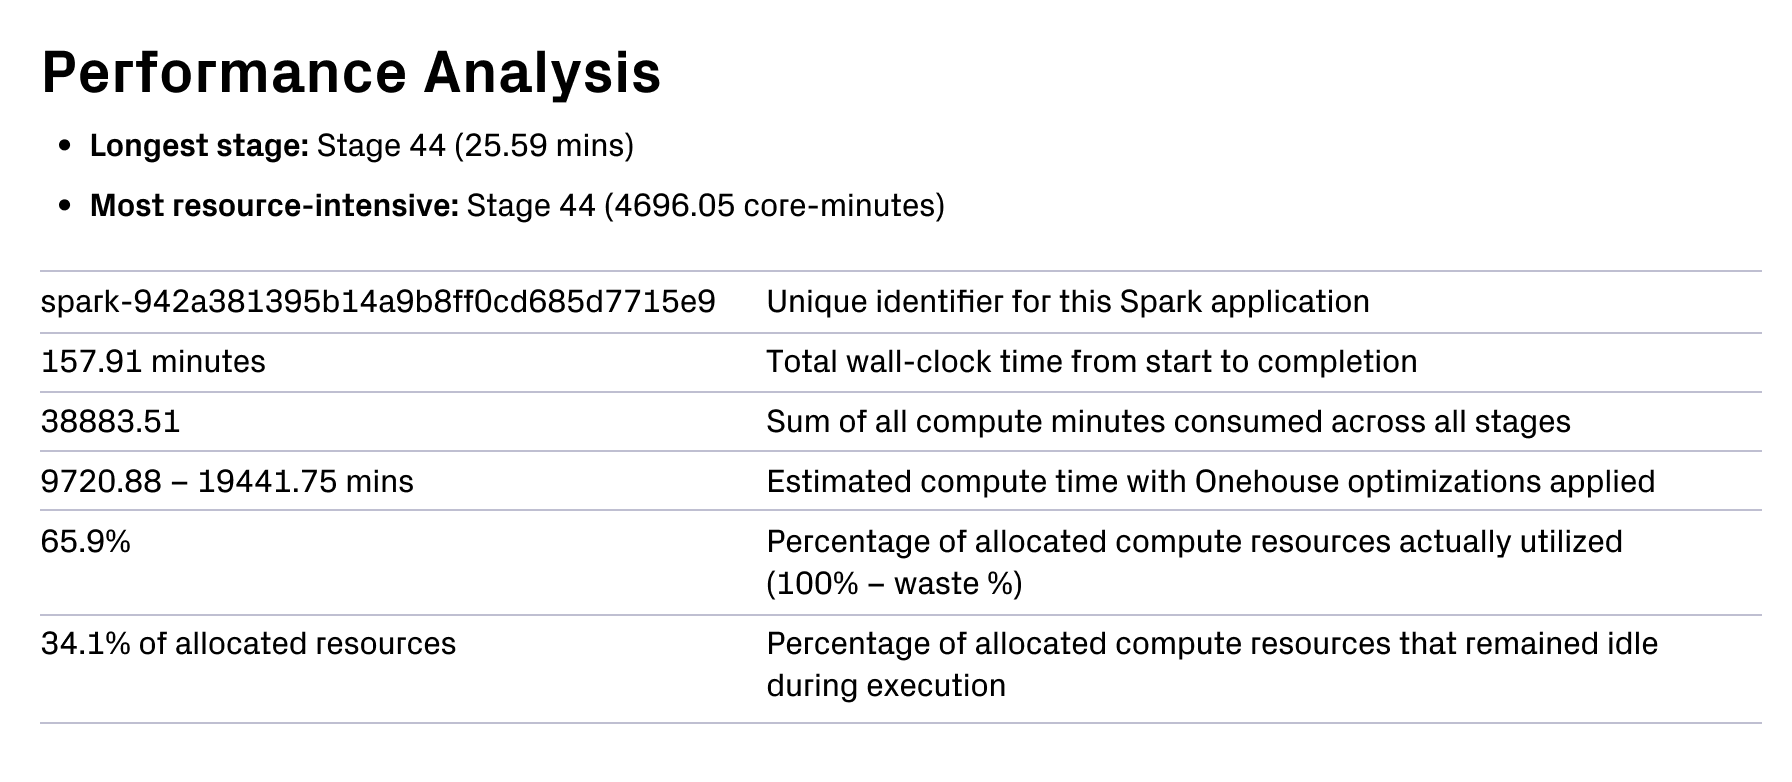
Performance and Runtime Insights:
The Spark Analyzer provides an overall view of the performance of your job. Within each Spark Analyzer report, a performance analysis section provides you insights into your most resource intensive operations, and along with insights into:
- Wall-clock time for the application
- % of allocated compute that is actually utilized by Spark operations
- % of allocated compute that is wasted and remains idle across your application
Sample performance and runtime insights
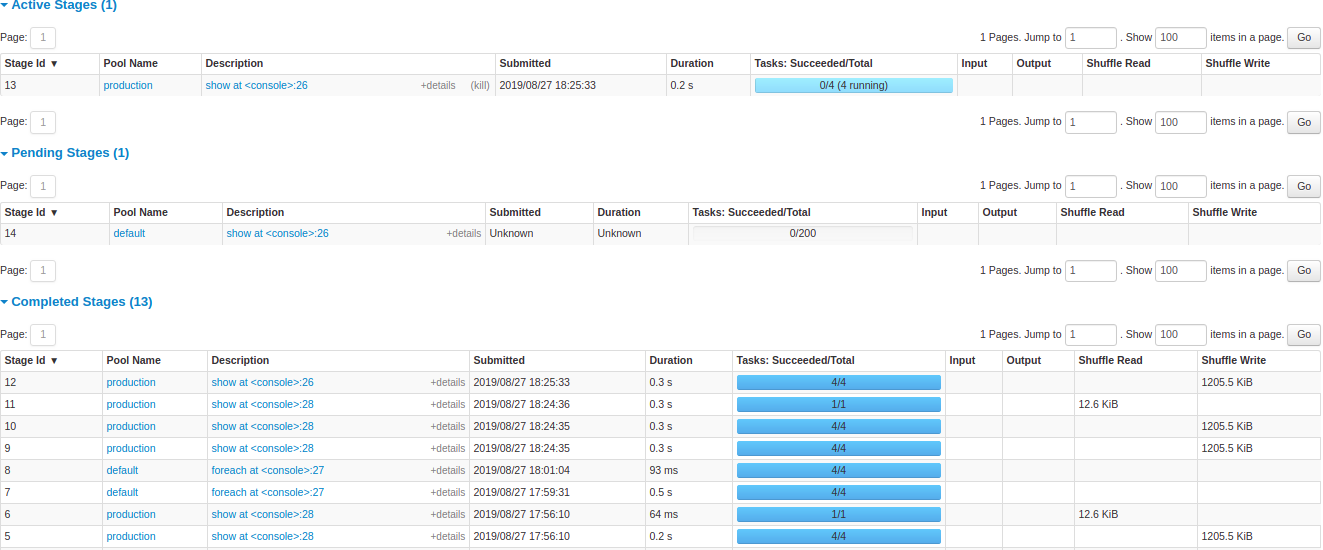
Stage-Level activity insights:
As many of us know, one of the fundamental building blocks of Spark is the “Spark stage”. Here, stages are executed one by one and are parallelized into dozens or hundreds of tasks. When running Spark applications, a single stage can often skew the overall performance of the job by hanging, or not using enough parallelism in its operations. That’s why the Spark Analyzer provides a stage by stage breakdown of activities. It looks at each stage’s operation type and how much resources are used and/or wasted during this stage’s execution. From there, you can leverage spark and lakehouse best practices to speed and tune up slow running stages.
Example of stage level breakdown:

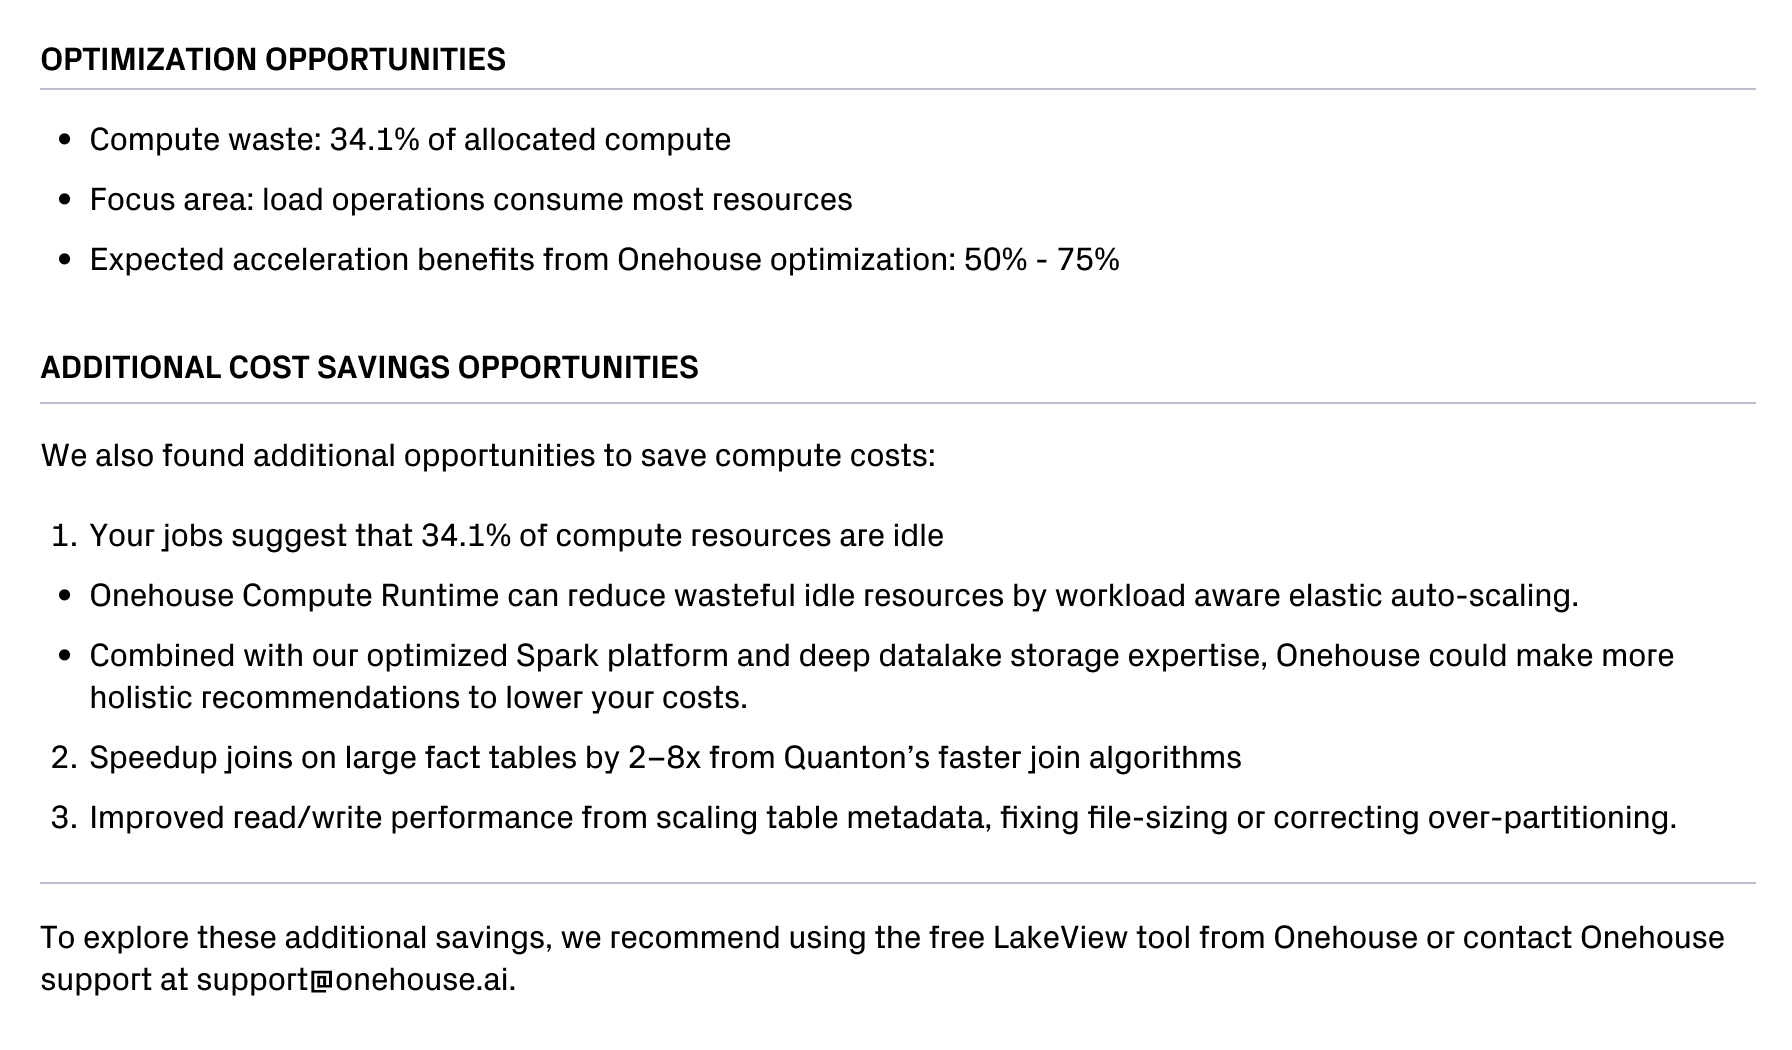
Quanton Engine Accelerations:
In May, at Onehouse, we launched a new native Spark execution engine - Quanton. Quanton accelerates the performance of Spark jobs by reducing the “quantum” of work performed in each ETL run. Quanton does this by intelligently exploiting workload patterns from each of the steps taken across E, T, and L. For lakehouse workloads, we’re so confident in Quanton’s performance gains that we will even guarantee at least 30% cost/performance improvement over your existing data platform. To read more about how Quanton drives these exciting performance improvements, check out our launch blog.
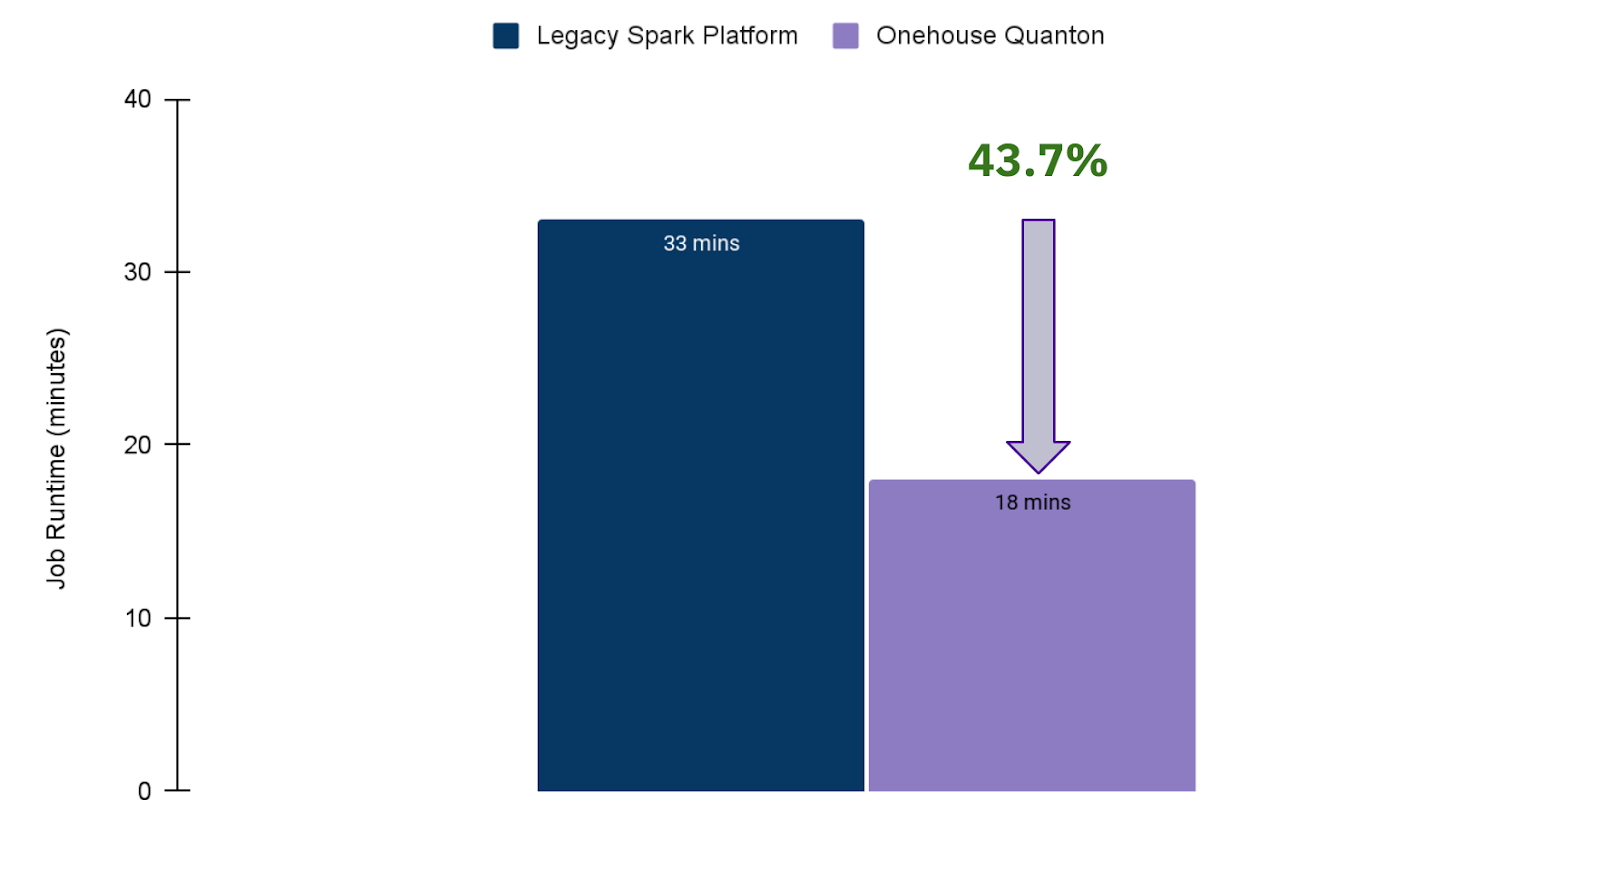
Built into the Spark Analyzer is also the ability to see what Quanton means for your Spark Jobs. Since Spark Analyzer breaks down the E, T and L workload patterns from your Spark jobs, it can also predict how much Quanton will be able to exploit these workload patterns to drive performance on your job - all with zero code changes. In your Spark Analyzer report, you will see a percent acceleration estimate for the same job running on Quanton. For example, if a report shows a 50% expected acceleration, then Spark Analyzer expects the job to run twice as fast when using the same compute profile, thus saving you cost by finishing the job early. You can see an example of this from a live Quanton customer’s performance gains below.
Example Report Output with Quanton Predictions
Customer Job Acceleration from Quanton We have high confidence in the accuracy of our Spark Analyzer predictions. Below is the result of the actual impact on one of our customer’s production workloads that they migrated from AWS EMR. For this workload, Spark Analyzer predicted a 27% acceleration. In real life, Quanton significantly outperformed our estimates.
Success Stories
Spark Analyzer is already helping dozens of organizations unlock deeper insights into their Spark jobs—driving both cost savings and major performance gains. And it works with or without Quanton.
- Without Quanton: Data Engineers leveraged Spark Analyzer insights to rework lakehouse table layouts and parallelism configs after discovering Spark spent 60%+ of job time writing files.
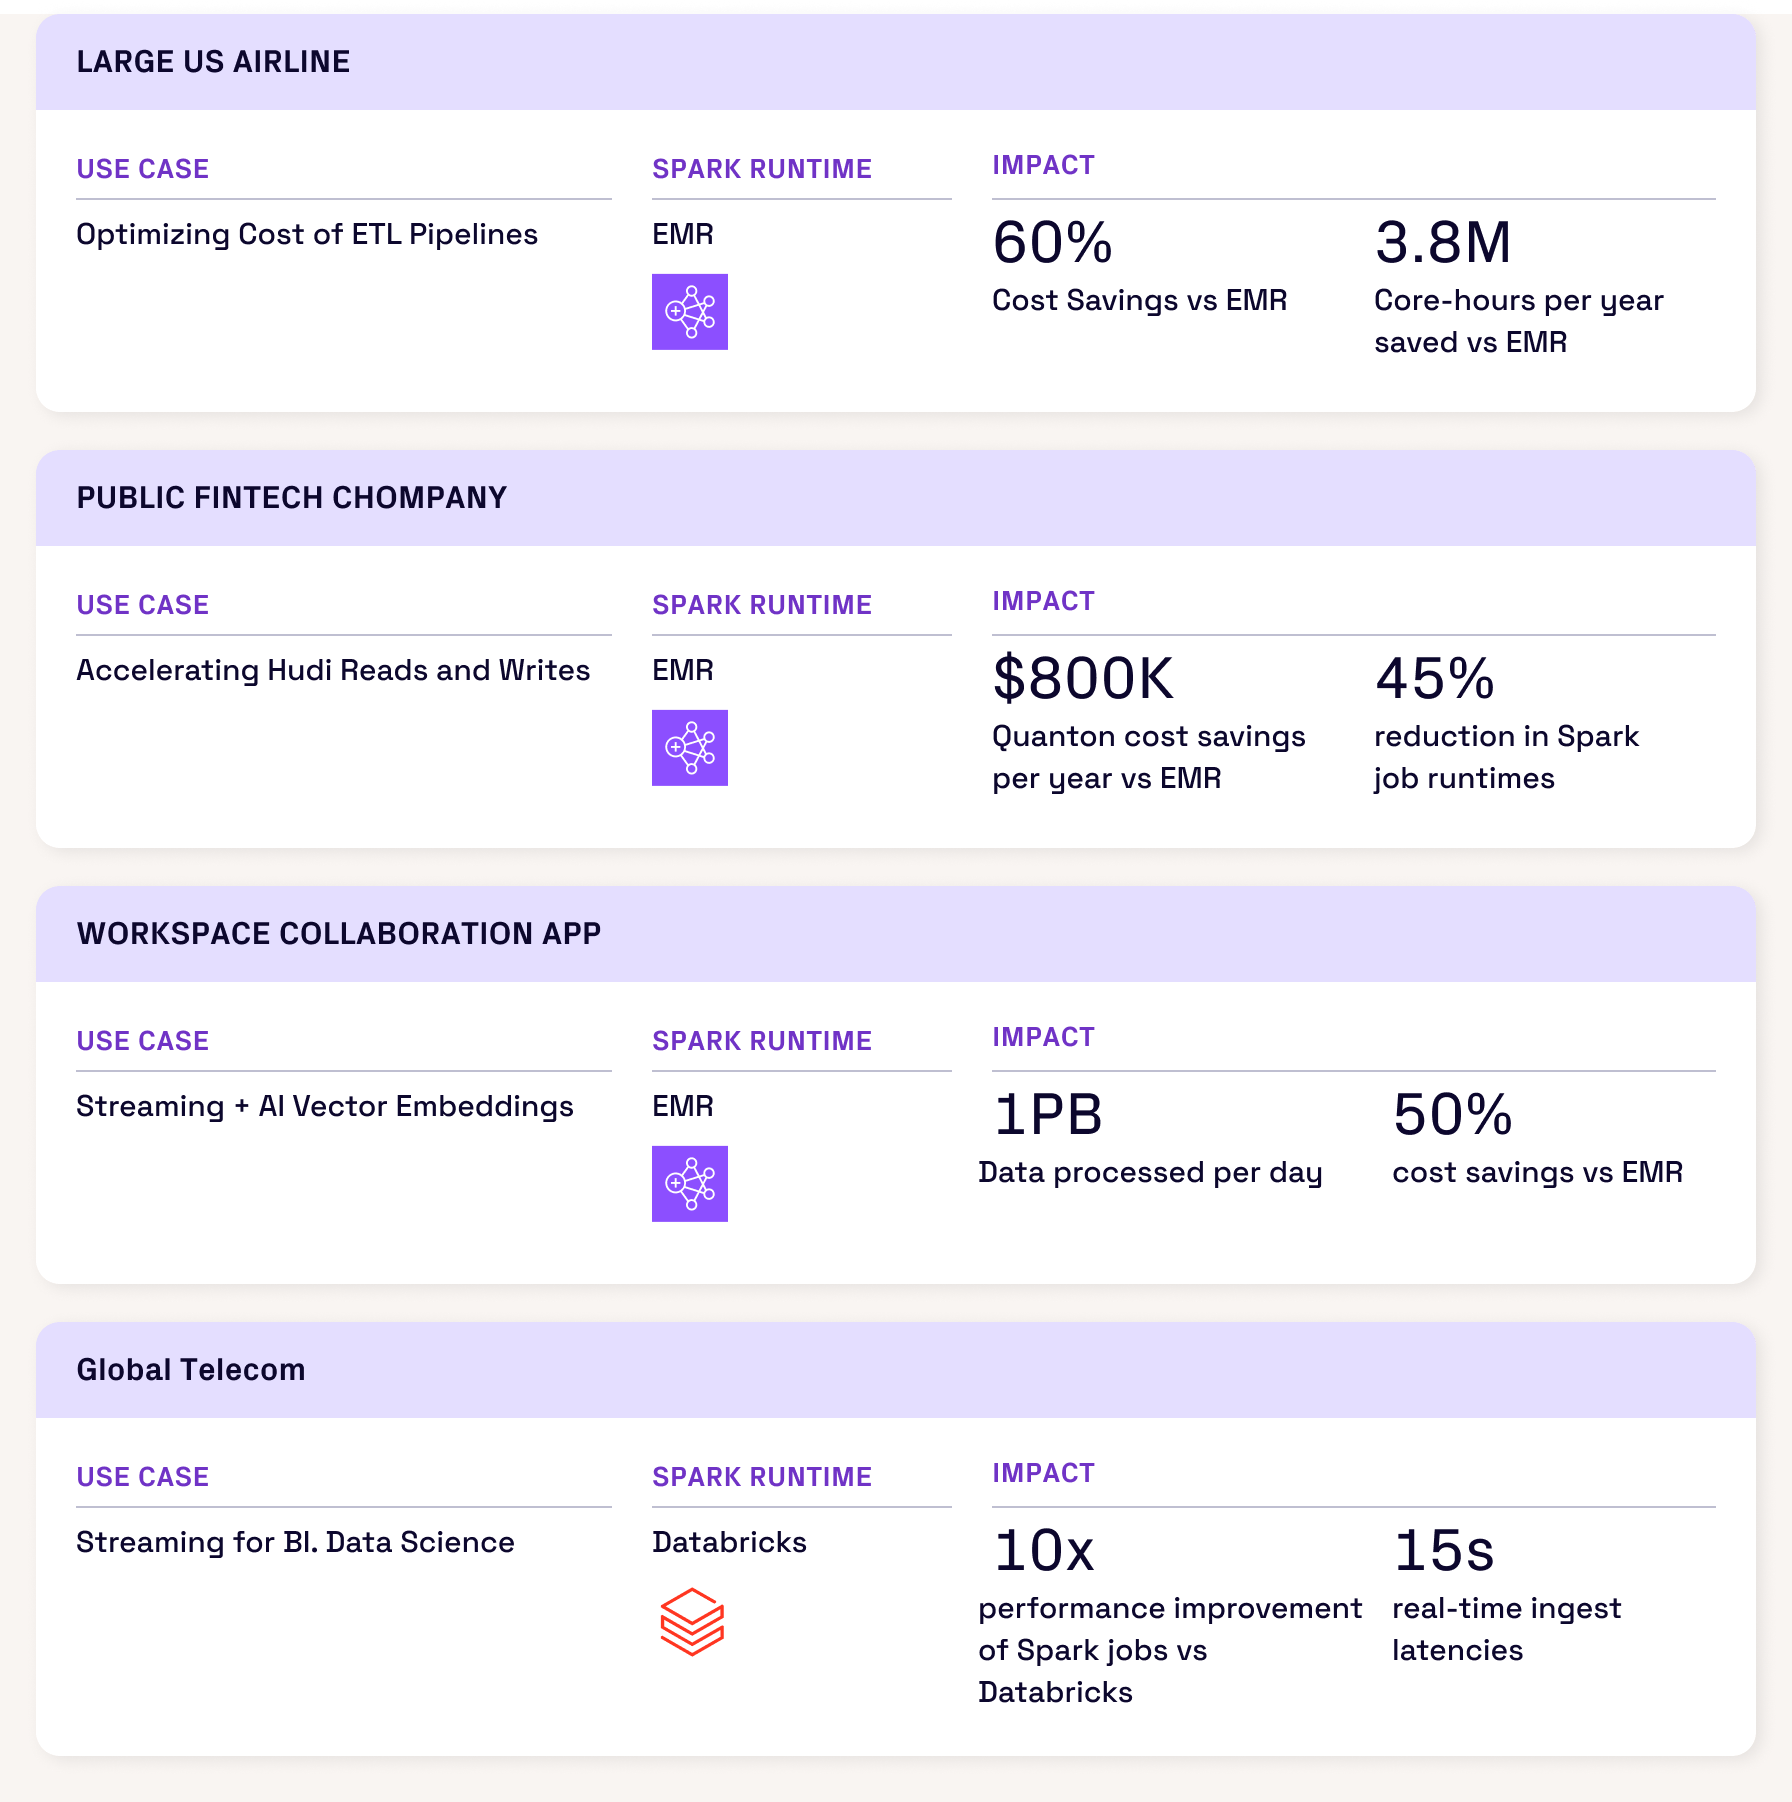
Impact: 40% faster overall job performance and 38% reduction in job costs - With Quanton: Onehouse customers migrated jobs from EMR, Databricks, and other Spark platforms—and immediately saw 40–60% performance accelerations.
See below for real-world examples of the impact powered by Quanton.
Try It Now
The bottom line is simple - stop guessing why your Spark jobs are slow or expensive, and start using data to identify bottlenecks and mitigate them proactively. Spark Analyzer gives you the tools to do that with just minutes of setup time, all without sharing any sensitive data outside of your computer.
Easy Steps to follow:
- pip install spark-analyzer. PyPI package linked here
- Point it to your Spark history server or active Spark UI
- Generate the analysis reports and take action to optimize your jobs
If you are interested in learning more about how Quanton will boost your Spark performance, the Onehouse engineering and solutions teams will work with you to create a free cost impact analysis to see how much your team can save (hint: it may be in the millions). Book a free assessment and test drive here:https://www.onehouse.ai/schedule-a-test-drive


Read More:


Subscribe to the Blog
Be the first to read new posts